While breakdown maintenance is sometimes unavoidable, organizations that rely heavily on this approach face significantly higher costs, increased safety risks, and unpredictable operational disruptions. Understanding what causes breakdowns, their true impact, and how to minimize unplanned failures is essential for maintenance managers seeking to optimize reliability and reduce costs.
In this comprehensive guide, we'll explore everything you need to know about breakdown maintenance—from clear definitions and real-world examples to cost analysis, prevention strategies, and best practices for emergency response.
What Is Breakdown Maintenance?
Breakdown maintenance refers to the corrective actions taken after equipment has completely failed or broken down, preventing it from performing its intended function. Unlike planned maintenance activities, breakdowns occur unexpectedly, requiring immediate response to restore operations.
This maintenance approach is characterized by several key features:
Breakdown maintenance is also commonly referred to as "run-to-failure" maintenance when applied intentionally to non-critical assets, or "emergency maintenance" when unexpected failures require urgent response.
Breakdown Maintenance Meaning in Context
The breakdown maintenance meaning extends beyond simple equipment repair. It represents a fundamental maintenance philosophy—whether intentional or accidental—of allowing assets to operate until they fail rather than performing scheduled maintenance to prevent failures.
For maintenance professionals, understanding breakdown maintenance involves recognizing:
- The failure point: When equipment can no longer perform its required function
- The response requirement: Immediate action needed to restore operations
- The business impact: How unplanned downtime affects overall operations
- The cost implications: Direct repair costs plus hidden expenses
- The safety considerations: Increased risk during unexpected failures
In practice, breakdown maintenance represents the most expensive and disruptive maintenance approach for critical equipment, though it may be economically justified for certain non-critical assets.

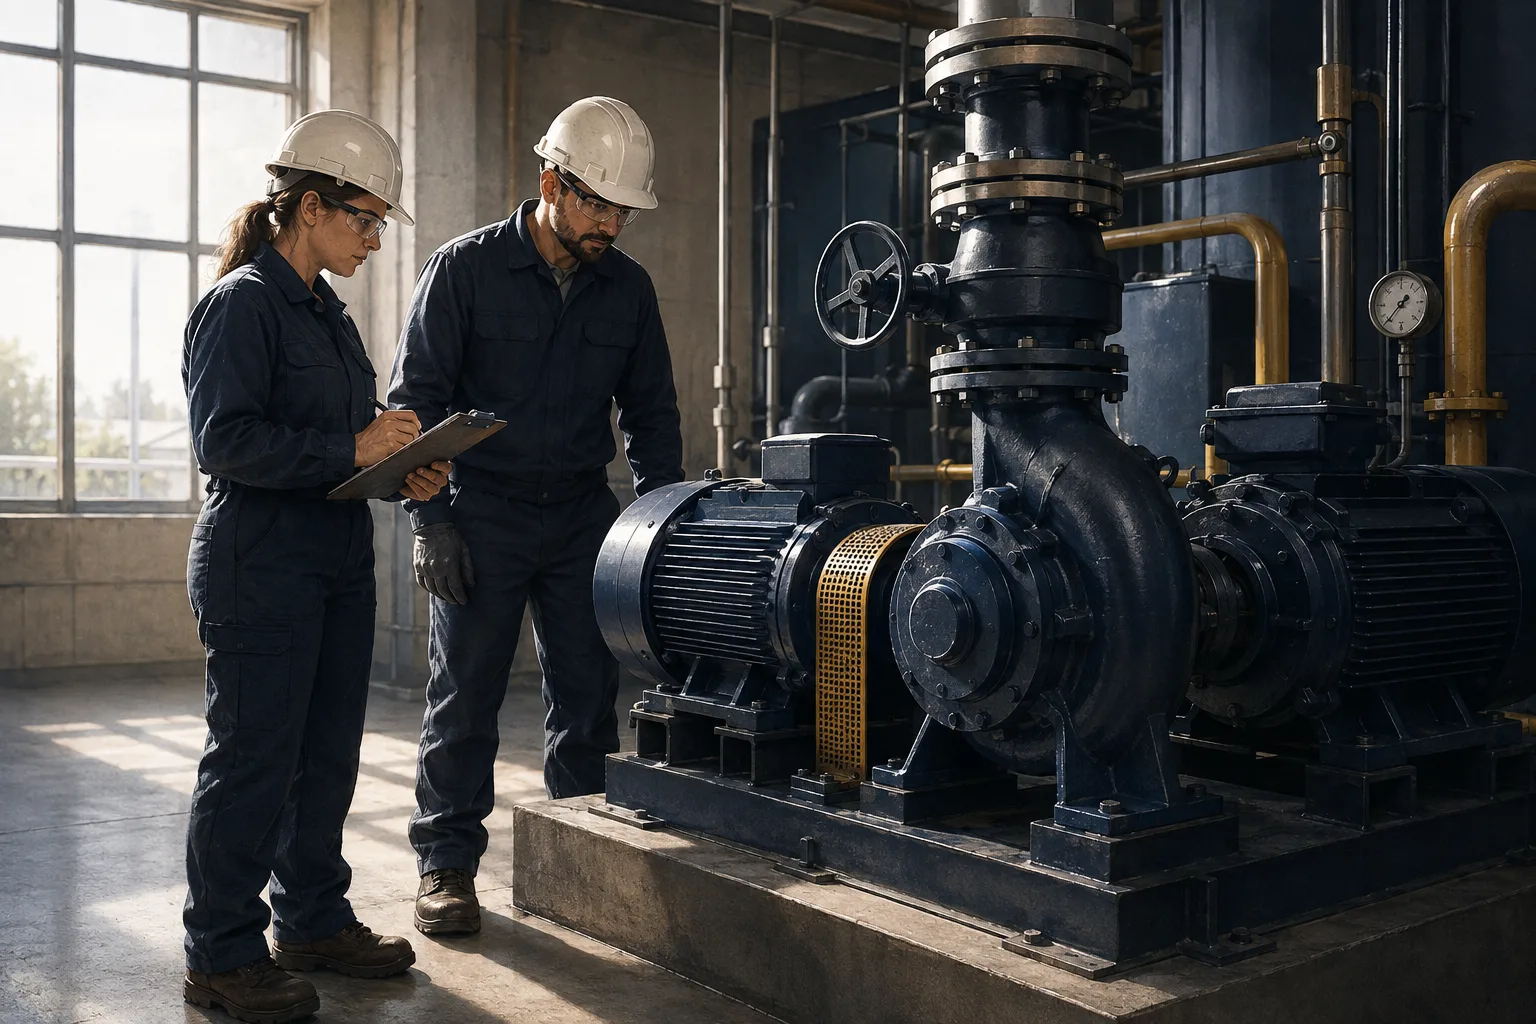
AI-generated editorial illustration; not a customer photograph or product screenshot.
Breakdown Maintenance vs Corrective Maintenance: Understanding the Difference
Many maintenance professionals use "breakdown maintenance" and "corrective maintenance" interchangeably, but there are important distinctions:
Breakdown Maintenance:
- Occurs after complete equipment failure
- Always unplanned and reactive
- Equipment cannot function at all
- Requires emergency response
- Typically involves complete operational stoppage
Corrective Maintenance:
- Addresses identified defects or deteriorating conditions
- Can be planned or unplanned
- Equipment may still be partially functional
- May be scheduled based on condition monitoring
- Can involve repairs before complete failure
Think of corrective maintenance as the broader category that includes breakdown maintenance. All breakdown maintenance is corrective, but not all corrective maintenance involves complete breakdowns. Corrective maintenance might address a leaking seal discovered during inspection (planned), while breakdown maintenance responds to a pump that has completely seized (unplanned).
Breakdown Maintenance vs Reactive Maintenance: How They Relate
Breakdown maintenance and reactive maintenance are closely related concepts:
Reactive Maintenance is the overarching philosophy of responding to problems after they occur rather than preventing them. It includes:
- Breakdown maintenance (after complete failure)
- Emergency repairs
- Unplanned corrective actions
- Run-to-failure strategies
Breakdown Maintenance is a specific type of reactive maintenance that occurs after complete equipment failure.
The relationship: All breakdown maintenance is reactive, but reactive maintenance also includes responses to partial failures, performance degradation, and other issues that don't constitute complete breakdowns.
Organizations seeking to reduce reactive maintenance must specifically target breakdown maintenance reduction, as this represents the most costly and disruptive reactive activity.
Types of Breakdown Maintenance
1. Emergency Breakdown Maintenance (Unplanned Failure)
This type occurs when critical equipment fails unexpectedly, requiring immediate response to prevent safety hazards or severe operational impact.
Characteristics:
- No warning or advance notice
- Immediate safety or production impact
- Requires emergency technician callout
- Often involves expedited parts ordering
- Highest cost and disruption level
Example: A critical production line conveyor motor fails at 2 AM, halting manufacturing and requiring emergency technician response.
2. Run-to-Failure Breakdown Maintenance (Planned Failure)
A deliberate strategy for non-critical assets where the cost of preventive maintenance exceeds the cost of allowing failure and repair.
Characteristics:
- Intentional decision to allow failure
- Applied to non-critical, low-cost equipment
- Failure won't impact safety or critical operations
- Replacement cost is lower than prevention cost
- Often involves keeping spare units on hand
Example: Light bulbs, disposable filters, or low-cost redundant equipment where replacement is more economical than scheduled maintenance.
The key distinction: Emergency breakdowns are failures we want to prevent, while run-to-failure is a conscious economic decision for specific assets.
Common Causes of Equipment Breakdown
1. Lack of Preventive Maintenance
The single largest cause of equipment breakdown is insufficient or non-existent preventive maintenance programs. Without regular inspections, lubrication, adjustments, and component replacements, equipment deteriorates until failure becomes inevitable.
2. Age and Normal Wear
Prevention approach: Condition-based monitoring and planned component replacement before reaching failure threshold.
4. Environmental Factors
External conditions accelerate equipment degradation:
- Temperature extremes causing thermal stress
- Humidity promoting corrosion and electrical failures
- Dust and contamination damaging seals and bearings
- Vibration from nearby equipment
- Chemical exposure deteriorating materials
5. Poor Installation or Commissioning
Equipment improperly installed will fail prematurely:
- Misalignment causing excessive wear
- Incorrect electrical connections
- Improper foundation or mounting
- Wrong lubricant types or quantities
- Failure to follow manufacturer specifications
7. Equipment Overloading
Operating equipment beyond designed capacity accelerates wear and causes premature failure:
- Exceeding rated capacity or speed
- Extended operation beyond duty cycle ratings
- Insufficient cooling time between operations
- Pushing equipment during production pressure
8. Lack of Spare Parts
While not a direct cause of initial failure, inadequate spare parts inventory converts minor issues into extended breakdowns:
- Long lead times for critical components
- No local supplier availability
- Obsolete equipment with discontinued parts
- Insufficient spare parts budget
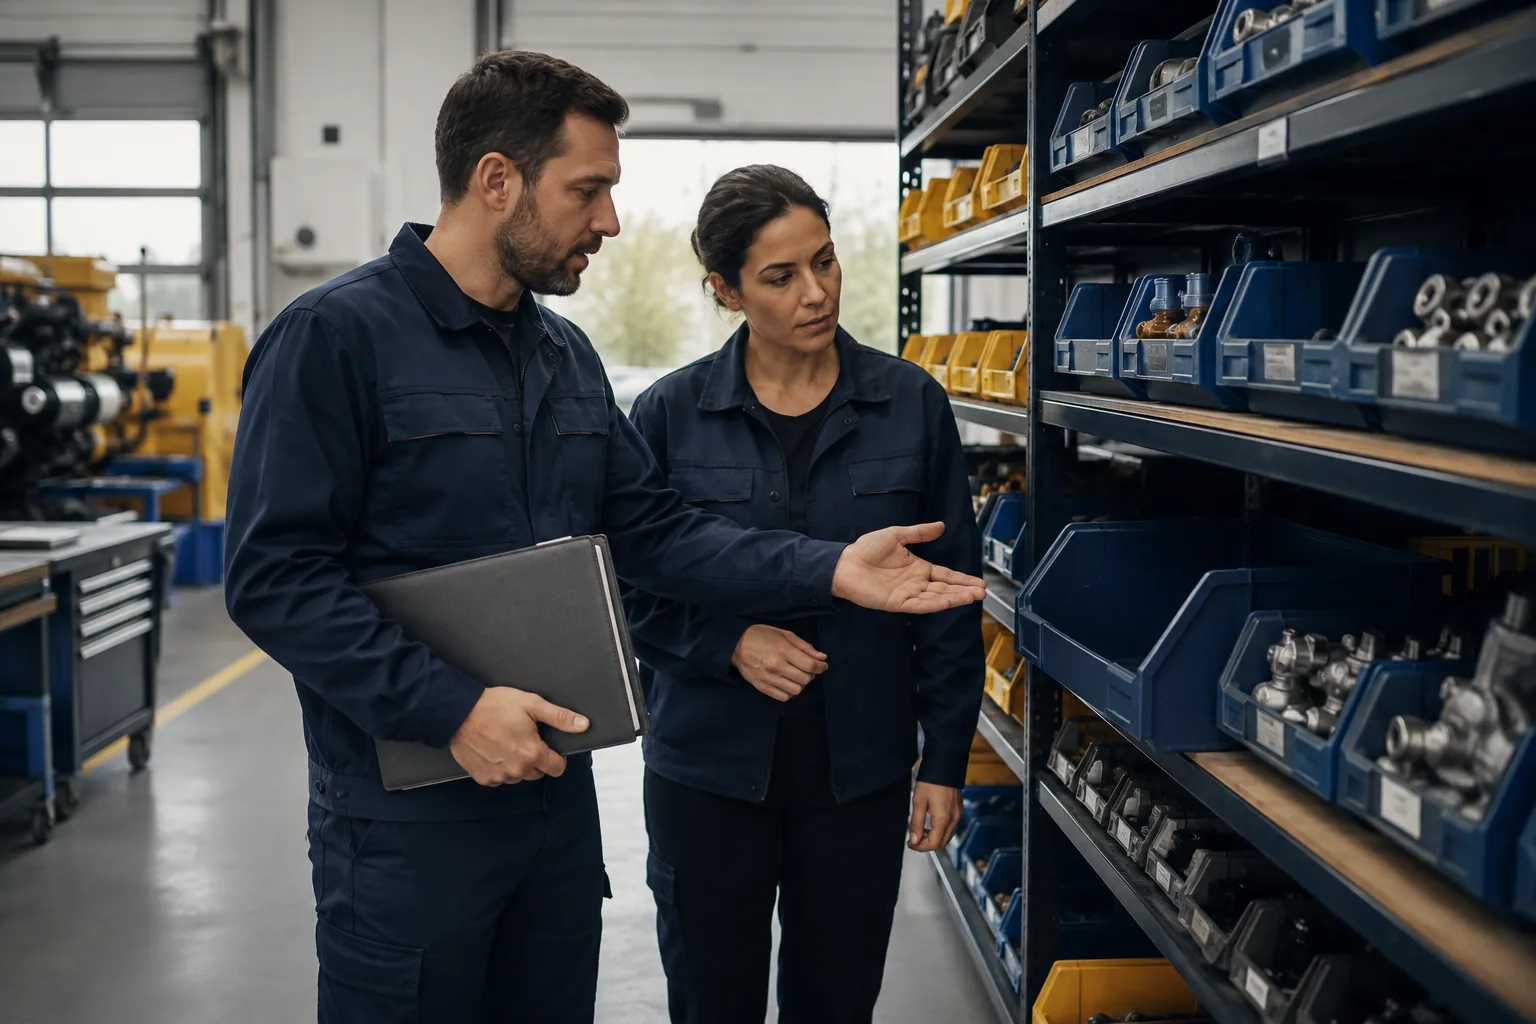
AI-generated editorial illustration; not a customer photograph or product screenshot.
The True Cost of Breakdown Maintenance
Most organizations dramatically underestimate the real cost of equipment breakdowns by focusing only on direct repair expenses. The complete financial impact includes both visible and hidden costs.
Indirect and Hidden Costs
Secondary Damage: Initial failures often cause cascading damage to connected systems:
- Overheating in one component damaging adjacent equipment
- Contamination spreading through systems
- Electrical faults damaging multiple components
- Mechanical failures destroying mating parts
Quality and Scrap Costs: Equipment failures during production create quality issues:
- Defective products requiring rework or scrap
- Raw material waste
- Quality testing and inspection costs
- Potential customer returns and warranty claims
Schedule Disruption: Breakdowns create ripple effects throughout operations:
- Missed delivery deadlines and penalty costs
- Rush charges for alternative arrangements
- Customer relationship damage
- Lost future business opportunities
Deferred Maintenance Backlog: Emergency breakdowns consume maintenance resources:
- Planned work gets postponed
- Preventive maintenance skipped, increasing future breakdown risk
- Maintenance team burnout and overtime fatigue
Cost Comparison: Breakdown vs Preventive Maintenance
Impact of Breakdown Maintenance on Operations
Impact on Production and Operations
Production Disruption:
- Unscheduled line stoppages
- Inability to meet production targets
- Schedule chaos and replanning requirements
- Overtime production to compensate for lost time
Inventory Challenges:
- Work-in-process inventory damaged or wasted
- Raw material spoilage during unplanned delays
- Finished goods inventory shortages
- Supply chain disruption
Impact on Maintenance Budget and Resources
Resource Inefficiency:
- Maintenance teams in constant firefighting mode
- No time for planned improvements
- Inefficient parts purchasing at premium prices
- Excessive contractor dependence
Impact on Team Morale
Maintenance Team Effects:
- Chronic stress from emergency response environment
- Lack of work-life balance due to unpredictable callouts
- No satisfaction from preventive work preventing problems
- High turnover among skilled technicians
- Difficulty recruiting experienced staff
Operations Team Effects:
- Frustration with production unpredictability
- Tension between maintenance and production
- Blame culture developing around failures
Impact on Safety
Regulatory Compliance:
- Safety violations during emergency work
- Incomplete lockout/tagout procedures
- Inadequate safety planning for unplanned work
Impact on Asset Life
Accelerated Deterioration: Breakdown maintenance shortens overall equipment life:
- Operating equipment in degraded condition until failure
- Catastrophic failures causing collateral damage
- Emergency repairs often temporary rather than proper fixes
- Lack of proper root cause analysis allowing repeat failures
Lower Asset Value:
- Reduced equipment resale value
- Higher replacement frequency
- Inability to achieve designed equipment lifespan
When Breakdown Maintenance Is Acceptable
Despite its drawbacks, breakdown maintenance is sometimes the economically appropriate strategy. Understanding when run-to-failure makes sense prevents wasting resources on unnecessary preventive work.
Criteria for Intentional Run-to-Failure
Breakdown maintenance may be justified when ALL these conditions are met:
- Non-Critical Assets: Equipment failure won't impact safety, critical operations, or significant revenue
- Low Repair Cost: Repair/replacement cost is lower than preventive maintenance cost
- No Secondary Damage: Failure won't damage other equipment or create safety hazards
- Predictable Failure Mode: Failures occur in safe, manageable ways
- Available Redundancy: Backup equipment or capacity exists
- Quick Repair: Restoration can be accomplished rapidly
- Inexpensive Parts: Replacement components are readily available at low cost
Appropriate Run-to-Failure Examples
Acceptable Breakdown Maintenance Applications:
- Light bulbs and minor lighting fixtures
- Non-critical office equipment
- Redundant pumps or fans where multiple units provide backup
- Low-cost hand tools
- Disposable filters in non-critical applications
- Decorative or aesthetic elements
- Equipment approaching end-of-life replacement date
When Breakdown Is NOT Acceptable
Never use breakdown maintenance for:
- Critical production equipment
- Safety systems
- Single-point-of-failure assets
- Equipment where failure causes secondary damage
- Assets where failure creates hazardous conditions
- High-repair-cost equipment
- Equipment with long repair lead times
The key principle: Intentional run-to-failure is a conscious economic decision based on thorough analysis, not neglect or lack of planning.

AI-generated editorial illustration; not a customer photograph or product screenshot.
How to Reduce Breakdown Maintenance
Organizations can dramatically reduce unplanned equipment failures through systematic approaches focused on prevention, prediction, and continuous improvement.
1. Implement a Comprehensive Preventive Maintenance Program
Preventive maintenance represents the foundation of breakdown reduction:
Essential PM Program Elements:
- Equipment inventory and criticality assessment
- Manufacturer-recommended maintenance schedules
- Task procedures for inspections, lubrication, adjustments
- Planned component replacement before failure
- Regular calibration and testing
- Documentation and completion tracking
Implementation Approach:
- Start with critical equipment first
- Build schedules based on OEM recommendations
- Assign clear ownership and accountability
- Track completion rates and measure impact
- Adjust frequencies based on results
2. Deploy Predictive Technologies
Predictive maintenance uses condition monitoring to identify developing problems before failure:
Key Technologies:
| Technology | What It Detects | Best Applications |
|---|---|---|
| Vibration Analysis | Bearing wear, imbalance, misalignment, looseness | Rotating equipment, motors, pumps, fans |
| Infrared Thermography | Electrical hotspots, thermal anomalies, insulation issues | Electrical systems, steam traps, mechanical systems |
| Ultrasonic Testing | Leaks, electrical discharge, bearing defects | Compressed air systems, electrical equipment, bearings |
| Oil Analysis | Contamination, wear particles, degradation | Hydraulic systems, engines, gearboxes |
| Motor Circuit Analysis | Winding degradation, insulation breakdown | Electric motors and generators |
Implementation Strategy:
- Focus predictive technologies on high-value, critical assets
- Establish baseline readings for normal operation
- Create alert thresholds for investigation
- Train technicians in technology interpretation
- Integrate findings into maintenance planning
3. Improve Operator Training and Engagement
Well-trained operators prevent breakdowns through proper equipment use and early problem detection:
Operator Care Programs:
- Basic equipment operation training
- Proper startup and shutdown procedures
- Daily inspection checklists
- Early warning sign recognition
- First-level maintenance tasks (cleaning, lubrication)
- Abnormality reporting processes
4. Track and Analyze Failure Patterns
Understanding what breaks, when, and why enables targeted prevention:
Failure Tracking Essentials:
- Document all breakdowns with detailed information
- Record failure mode, cause, and corrective action
- Track time between failures for each asset
- Analyze patterns by equipment type, location, time
- Calculate breakdown frequency and costs
- Identify repeat failures requiring different approaches
Analysis Methods:
- Pareto analysis to identify high-impact failure modes
- Trend analysis for deteriorating equipment
- Failure mode and effects analysis (FMEA)
- Reliability-centered maintenance (RCM) for critical assets
5. Conduct Root Cause Analysis
Root Cause Analysis Process:
- Describe the failure: What exactly happened?
- Collect evidence: Inspect failed components, review records
- Identify immediate causes: What directly caused the failure?
- Find underlying causes: Why did the immediate cause occur?
- Discover root causes: What systemic factors allowed this?
- Develop solutions: How can we eliminate root causes?
- Implement and verify: Apply fixes and confirm effectiveness
Common Root Cause Categories:
- Inadequate preventive maintenance
- Design deficiencies
- Improper operation
- Environmental factors
- Quality issues with parts or materials
- Installation errors
Tools:
- 5 Whys questioning technique
- Fishbone (Ishikawa) diagrams
- Fault tree analysis
- Failure mode analysis
6. Optimize Spare Parts Management
Strategic spare parts inventory prevents minor issues from becoming extended breakdowns:
Critical Spares Strategy:
- Identify critical components with long lead times
- Stock spares for equipment with high failure costs
- Establish relationships with suppliers for emergency parts
- Consider vendor-managed inventory for critical items
- Balance inventory costs against breakdown risk
Inventory Optimization:
- ABC analysis: A items (critical, expensive), B items (important), C items (low-value)
- Stock A items with long lead times
- Establish supplier agreements for rapid B item delivery
- Purchase C items as needed
7. Implement a Computerized Maintenance Management System (CMMS)
Modern CMMS software provides essential tools for breakdown reduction:
CMMS Capabilities for Breakdown Prevention:
- Preventive maintenance scheduling and tracking
- Work order management and documentation
- Failure history and analysis
- Equipment reliability metrics
- Predictive maintenance alert integration
- Spare parts inventory management
- Mobile access for real-time information
A comprehensive CMMS creates visibility into failure patterns, ensures preventive work doesn't get skipped, and provides the data needed for continuous improvement.
AI-generated editorial illustration; not a customer photograph or product screenshot.
Breakdown Maintenance Response Best Practices
Even with excellent prevention programs, some breakdowns will occur. Effective emergency response minimizes their impact.
Emergency Response Planning
Develop Equipment-Specific Response Plans:
- Identify critical equipment requiring emergency response procedures
- Document immediate safety actions
- List required tools and spare parts
- Define notification and escalation processes
- Establish repair versus replace decision criteria
- Create troubleshooting guides for common failures
Emergency Contact System:
- On-call technician schedules
- Vendor emergency contact information
- Parts supplier after-hours contacts
- Contractor backup resources
- Management escalation contacts
Spare Parts Strategy
Critical Spares Program:
- Maintain on-site inventory of high-failure, long-lead-time components
- Pre-identify alternative part sources
- Establish relationships with emergency parts suppliers
- Consider consignment inventory for expensive critical parts
- Document part numbers and specifications in readily accessible location
Emergency Procurement:
- Pre-negotiated emergency service agreements
- Corporate credit accounts with suppliers
- Authority limits for emergency purchases
- Expedited shipping arrangements
Technician Training and Preparedness
Emergency Repair Capabilities:
- Cross-training for coverage across equipment types
- Regular emergency scenario drills
- Access to technical documentation and drawings
- Troubleshooting skill development
- Safety training for emergency conditions
Mobile Readiness:
- Equipped emergency response kits
- Mobile device access to documentation and procedures
- Communication equipment
- Basic diagnostic tools always available
Documentation and Learning
Breakdown Documentation Requirements: Every breakdown should be documented with:
- Equipment identification and location
- Date and time of failure
- Failure description and symptoms
- Root cause identification
- Repair actions taken
- Parts used and costs
- Labor hours and costs
- Total downtime
- Preventive actions to avoid recurrence
Post-Breakdown Review:
- Conduct analysis for all significant breakdowns
- Share lessons learned across maintenance team
- Update preventive maintenance tasks if needed
- Revise emergency procedures based on experience
- Track effectiveness of implemented improvements
Emergency Work Safety
Critical Safety Considerations:
- Never compromise safety for speed
- Ensure proper lockout/tagout even under pressure
- Use appropriate personal protective equipment
- Conduct pre-job hazard analysis
- Ensure adequate lighting and workspace
- Have second person available for high-risk work
- Don't allow fatigued technicians to work on critical repairs
Breakdown Maintenance vs Preventive Maintenance: The Cost-Benefit Analysis
Understanding the economic contrast between reactive and proactive strategies helps justify preventive maintenance investment.
Comprehensive Cost Comparison
| Cost Factor | Breakdown Maintenance | Preventive Maintenance |
|---|---|---|
| Labor costs | Emergency rates, overtime, off-hours premium | Regular-time, planned scheduling |
| Parts costs | Expedited shipping, rush charges, premium pricing | Standard pricing, bulk discounts, planned procurement |
| Downtime | Unplanned, extended duration, production impact | Scheduled during low-impact periods |
| Secondary damage | Common due to catastrophic failures | Rare, problems caught early |
| Equipment life | Shortened by operating in degraded condition | Extended through proper care |
| Scheduling impact | Major disruption to production | Minimal, planned around operations |
| Resource efficiency | Chaotic, reactive, firefighting mode | Organized, efficient, planned approach |
| Budget predictability | High variability, frequent overruns | Stable, predictable expenses |
| Safety risk | Higher due to urgent conditions | Lower, proper planning and preparation |
Financial Analysis Example
Scenario: A critical production pump
The Preventive Maintenance ROI
Despite these investments, total maintenance costs decrease as expensive breakdowns are replaced with less expensive preventive tasks.
Technology to Prevent and Manage Breakdowns
Modern technology provides powerful tools for both preventing breakdowns and responding effectively when they occur.
CMMS Role in Breakdown Prevention
A comprehensive CMMS (Computerized Maintenance Management System) serves as the central platform for breakdown reduction:
Preventive Maintenance Management:
- Automatically schedules PM tasks based on time, meter readings, or conditions
- Sends alerts when tasks are due
- Tracks completion and compliance
- Identifies skipped tasks that increase breakdown risk
- Manages task procedures and checklists
Failure Tracking and Analysis:
- Records all breakdown incidents
- Captures failure modes, causes, and costs
- Generates reliability metrics and trends
- Identifies repeat failures requiring attention
- Calculates mean time between failures (MTBF)
Work Order Management:
- Routes emergency work orders to appropriate technicians
- Provides mobile access to equipment history and procedures
- Tracks response times and repair durations
- Documents labor, parts, and total costs
- Enables real-time status updates
Inventory Optimization:
- Manages spare parts inventory
- Alerts for low stock on critical components
- Tracks parts usage patterns
- Optimizes reorder points and quantities
- Links parts to specific equipment
Predictive Maintenance Technologies
Advanced monitoring systems detect problems before breakdown:
Integrated Monitoring Platforms:
- Continuous equipment monitoring
- Automated alert generation
- Trend analysis and prediction
- Integration with CMMS for automated work orders
- Historical data storage and analysis
IoT and Smart Sensors:
- Wireless vibration sensors on rotating equipment
- Temperature sensors for thermal monitoring
- Pressure and flow sensors for system health
- Energy monitoring for performance degradation
- Cloud-based data collection and analysis
Artificial Intelligence and Machine Learning:
- Pattern recognition for early failure detection
- Predictive algorithms forecasting failure probability
- Anomaly detection identifying unusual conditions
- Optimization of maintenance intervals
- Remaining useful life estimation
Mobile Maintenance Technology
Mobile tools improve breakdown response:
Mobile CMMS Applications:
- Access equipment history in the field
- Review procedures and documentation
- Update work orders in real-time
- Capture photos and videos of failures
- Communication with team members
Augmented Reality (AR):
- Visual guidance for complex repairs
- Remote expert assistance
- Overlay of technical information on equipment
- Training for emergency procedures

AI-generated editorial illustration; not a customer photograph or product screenshot.
Measuring Breakdown Maintenance: KPIs and Tracking
What gets measured gets managed. Tracking the right metrics drives breakdown reduction.
Tracking and Reporting
Monthly Breakdown Reports:
- Total breakdown incidents by equipment
- Breakdown costs (labor, parts, downtime)
- Top failure modes and causes
- Repeat failures requiring attention
- Trend analysis versus previous periods
Equipment Reliability Dashboard:
- MTBF trends for critical assets
- Equipment availability percentages
- Breakdown frequency heat maps
- Cost analysis by equipment type
- Preventive maintenance compliance
Leading Indicators: Monitor these predictive metrics that indicate future breakdown risk:
- Preventive maintenance compliance percentage
- Condition monitoring alerts and trends
- Operator-reported abnormalities
- Overdue maintenance tasks
- Predictive technology findings requiring action
Lagging Indicators: Track these outcome metrics that measure breakdown impact:
- Total breakdown incidents
- Breakdown maintenance costs
- Unplanned downtime hours
- Production losses due to failures
- Safety incidents related to breakdowns
Benchmarking Performance
Breakdown Maintenance Action Plan: Getting Started
Phase 1: Assessment
1. Analyze Current State:
- Calculate current reactive maintenance percentage
- Document breakdown frequency and costs
- Identify equipment with highest breakdown rates
- Assess preventive maintenance program maturity
- Evaluate current tracking and documentation
2. Establish Baseline Metrics:
- Total annual breakdown costs
- Breakdown incidents per month
- MTBF for critical equipment
- Current PM compliance rate
- Equipment availability percentages
3. Prioritize Equipment:
- Conduct criticality assessment
- Identify highest-cost breakdown equipment
- Determine which assets justify preventive investment
- Identify appropriate run-to-failure candidates
Phase 2: Foundation Building
1. Implement or Optimize CMMS:
- Select and deploy maintenance management software
- Build equipment hierarchy and asset register
- Configure work order processes
- Establish mobile access for technicians
- Train team on system use
2. Develop Preventive Maintenance Program:
- Create PM task libraries based on OEM recommendations
- Build schedules for critical equipment
- Develop task procedures and checklists
- Assign ownership and accountability
- Establish compliance tracking
3. Create Emergency Response Procedures:
- Document critical equipment response plans
- Establish on-call schedules
- Build emergency contact lists
- Stock critical spare parts
- Develop troubleshooting guides
Phase 3: Implementation
1. Launch Preventive Program:
- Begin executing PM tasks on schedule
- Track completion and compliance
- Capture task findings and recommendations
- Adjust frequencies based on results
- Communicate progress to stakeholders
2. Implement Condition Monitoring:
- Deploy predictive technologies on critical assets
- Establish baseline readings
- Create alert thresholds
- Train technicians in interpretation
- Integrate findings into maintenance planning
3. Start Operator Care Program:
- Train operators on proper equipment use
- Implement daily inspection checklists
- Establish abnormality reporting process
- Define first-level operator maintenance tasks
Phase 4: Optimization (Months 7-12)
1. Analyze Results:
- Track breakdown reduction progress
- Calculate cost savings achieved
- Identify remaining high-breakdown equipment
- Review PM effectiveness by task
- Adjust strategies based on data
2. Conduct Root Cause Analysis:
- Systematically investigate repeat failures
- Implement corrective actions
- Verify effectiveness of solutions
- Update preventive tasks to address root causes
3. Continuous Improvement:
- Optimize PM frequencies based on failure data
- Expand predictive monitoring to additional assets
- Enhance technician skills through training
- Refine spare parts inventory
- Share success stories and lessons learned
Expected Results Timeline

AI-generated editorial illustration; not a customer photograph or product screenshot.
Frequently Asked Questions About Breakdown Maintenance
What's the difference between breakdown and corrective maintenance?
Breakdown maintenance is a type of corrective maintenance that occurs after complete equipment failure when the asset cannot function at all. Corrective maintenance is the broader category that includes both breakdown repairs and planned corrective actions to fix identified defects before complete failure. All breakdown maintenance is corrective, but not all corrective maintenance involves breakdowns.
What are examples of breakdown maintenance?
Common breakdown maintenance examples include a production line motor failure requiring emergency replacement, a refrigeration compressor breakdown in food processing, an unexpected conveyor belt failure halting operations, a pump seal failure causing system shutdown, or a CNC machine spindle failure stopping manufacturing. These represent complete equipment failures requiring immediate repair response.
Is breakdown maintenance ever appropriate?
Yes, breakdown maintenance is appropriate for non-critical, low-cost assets where replacement cost is less than preventive maintenance cost. Acceptable run-to-failure applications include light bulbs, redundant equipment where backups exist, disposable filters, inexpensive hand tools, and equipment approaching planned replacement. This strategy should never be used for critical equipment, safety systems, or assets where failure causes secondary damage.
What is the relationship between breakdown maintenance and equipment reliability?
Breakdown maintenance and equipment reliability have an inverse relationship—higher reliability results in fewer breakdowns, while frequent breakdowns indicate low reliability. Reliability improvement through preventive maintenance, condition monitoring, and proper operation directly reduces breakdown frequency. Organizations measuring and improving reliability metrics like MTBF (mean time between failures) systematically decrease their dependence on breakdown maintenance while increasing equipment availability and performance.
Conclusion: Moving Beyond Breakdown Maintenance
Start by assessing your current breakdown maintenance percentage, identifying critical equipment with the highest failure costs, and building a foundational preventive maintenance program. Track your progress through key metrics like reactive maintenance percentage, MTBF, and breakdown costs, continuously refining your approach based on data and results.
Remember that some breakdown maintenance will always occur—and for certain non-critical assets, intentional run-to-failure may be the economically optimal strategy. The goal is not eliminating all reactive work but minimizing unplanned failures on critical equipment while maintaining excellent emergency response capabilities for unavoidable breakdowns.
Ready to Reduce Breakdown Maintenance Costs?
Download our Breakdown Reduction Checklist for a step-by-step implementation guide.