Skip to content
All guides

Maintenance guide

Equipment Asset Management Guide 2025 | EAM Systems

Master equipment asset management with proven strategies, EAM software comparison, lifecycle optimization, and ROI metrics. Reduce costs by up to 40%.

67 minute readBy PreventiveHQ Editorial TeamPublished 2025-10-15Content file updated 2026-06-1614,524 words
Editorial note: legacy articles are being re-reviewed for primary sources, dated claims and current product alignment. Verify safety, legal and regulatory requirements with the responsible authority before applying them.
Free PM schedule builder

Do the useful part now

Leave this guide with six real due dates

Define one recurring task, preview its next six dates and download a clean PM import worksheet—without giving us your email.

Choose the first due date to preview a six-occurrence maintenance rhythm.

Use this as a planning starter; qualified maintainers must approve task and safety details.

From worksheet to working system

See the complete handoff

  1. 1

    Approve one PM template

    Task steps, interval, ownership, parts and safety notes stay together.

  2. 2

    Generate work automatically

    Due work appears before the shift instead of living in a reminder sheet.

  3. 3

    Complete it in the field

    Technicians record steps, time, parts, readings and evidence.

  4. 4

    Adjust from history

    Planners can refine intervals using failure and completion evidence.

Automate this PM schedule

30 days free · no credit card · cancel anytime

Equipment Asset Management: Complete Guide for 2025

Equipment asset management (EAM) is a systematic approach to managing the entire lifecycle of physical equipment assets, from acquisition through operation, maintenance, and disposal, optimizing performance, costs, and compliance while maximizing return on investment. Organizations implementing comprehensive EAM systems report 25-40% reductions in maintenance costs and 15-30% improvements in equipment uptime.

Modern equipment asset management has evolved from simple inventory tracking to sophisticated, data-driven systems that integrate maintenance management, performance monitoring, compliance tracking, and lifecycle cost analysis. Whether managing manufacturing machinery, construction equipment, facility systems, or fleet vehicles, effective EAM is essential for operational excellence.

This comprehensive guide covers everything you need to implement and optimize equipment asset management, from fundamental concepts to advanced strategies that deliver measurable business results.

What is Equipment Asset Management?

Equipment asset management encompasses all activities involved in managing physical equipment throughout its operational lifecycle. Unlike simple asset tracking, EAM focuses on optimizing equipment performance, extending useful life, reducing total cost of ownership, and ensuring assets deliver maximum value.

Core Principles of Equipment Asset Management

Equipment asset management operates on several foundational principles that distinguish it from basic inventory management:

Lifecycle Perspective: EAM considers total cost and value from acquisition through disposal, not just purchase price. A $50,000 machine might cost $300,000 over its 15-year lifecycle when maintenance, energy, and downtime costs are included. Organizations using lifecycle costing report 18-25% better asset selection decisions according to Aberdeen Research.

Performance Optimization: Continuous monitoring and improvement of equipment effectiveness, reliability, and output quality. The gold standard is Overall Equipment Effectiveness (OEE), with world-class manufacturers achieving 85% OEE compared to industry averages of 60%. Each 1% OEE improvement can generate $100,000-500,000 in annual value for medium-sized operations.

Risk-Based Decision Making: Prioritizing resources based on asset criticality, failure probability, and consequence. Critical assets affecting safety or production receive preventive maintenance every 30-90 days, while non-critical assets may operate on condition-based or run-to-failure strategies. Risk-based approaches reduce maintenance spending by 15-20% while improving reliability.

Data-Driven Insights: Leveraging equipment data, performance metrics, and analytics to inform decisions. Organizations analyzing equipment data effectively reduce unplanned downtime by 30-50% according to Deloitte industrial IoT research. Predictive analytics can forecast failures 7-14 days in advance with 85-92% accuracy.

The Business Case for Equipment Asset Management

The financial impact of effective equipment asset management extends across multiple operational areas:

Manufacturing operations implementing comprehensive EAM systems achieve $2.5-4.5 million in annual savings for plants with $50 million in equipment value. These savings come from reduced downtime (35% improvement), lower maintenance costs (25% reduction), extended asset life (20% longer), and improved productivity (12% increase).

Construction companies with $20-100 million in equipment fleets report 15-25% reductions in ownership costs through better utilization tracking, preventive maintenance scheduling, and lifecycle replacement planning. Equipment utilization rates improve from 45-55% to 65-75%, effectively creating 20-30% more capacity without additional purchases.

Facility management organizations reduce total facility operating costs by 18-28% through integrated equipment management covering HVAC, electrical systems, elevators, and building automation. Energy costs alone decrease 10-20% through optimized equipment performance and timely maintenance.

For detailed asset management fundamentals, see our Asset Management Guide.

The Equipment Lifecycle: Managing From Acquisition to Disposal

Effective equipment asset management requires understanding and optimizing each phase of the equipment lifecycle. Each stage presents unique challenges and opportunities for value creation.

Stage 1: Planning and Acquisition

The equipment lifecycle begins before purchase, during the planning and specification phase where 60-70% of total lifecycle costs become locked in through design and selection decisions.

Needs Assessment and Justification: Rigorous analysis determines whether new equipment is necessary or if upgrading, repairing, or redeploying existing assets would suffice. Organizations using formal capital planning processes avoid 15-25% of unnecessary equipment purchases. Business case development should include total cost of ownership projections, capacity analysis, and alternatives evaluation.

Specification Development: Detailed requirements covering performance capabilities, maintenance requirements, energy consumption, safety features, and lifecycle support. Specifications should prioritize total cost of ownership over initial purchase price. Energy-efficient equipment costs 10-20% more initially but saves 25-40% over its lifecycle through reduced operating costs.

Vendor Selection and Procurement: Evaluating suppliers based on equipment quality, lifecycle support, parts availability, warranty terms, and service capabilities. Leading organizations score vendors on 10-15 criteria beyond price, including mean time between failures (MTBF), parts lead times, service response times, and training availability.

Lifecycle Cost Analysis: Calculating total ownership costs including purchase price, installation, training, energy, maintenance, downtime, and disposal. A comprehensive lifecycle cost model reveals that purchase price typically represents only 20-30% of total cost for most industrial equipment. For example:

| Cost Category | % of Total Lifecycle Cost | Example ($100K Asset) | |---------------|--------------------------|----------------------| | Purchase Price | 25% | $25,000 | | Installation & Commissioning | 8% | $8,000 | | Training & Documentation | 3% | $3,000 | | Energy/Operating Costs | 35% | $35,000 | | Preventive Maintenance | 12% | $12,000 | | Repairs & Parts | 10% | $10,000 | | Downtime Costs | 5% | $5,000 | | Disposal/Replacement | 2% | $2,000 | | Total 15-Year Cost | 100% | $100,000 |

Stage 2: Installation and Commissioning

Proper installation and commissioning establishes the foundation for reliable equipment performance throughout its operational life.

Installation Planning: Coordinating site preparation, utility connections, safety systems, and environmental controls. Poor installation causes 15-25% of early equipment failures. Installation checklists should cover foundation requirements, power quality, environmental conditions, and integration with existing systems.

Baseline Documentation: Creating comprehensive asset records including specifications, vendor information, warranty terms, maintenance requirements, operating procedures, and safety protocols. Complete documentation reduces technician troubleshooting time by 30-40% and prevents warranty claim rejections due to improper maintenance.

Initial Performance Testing: Validating that equipment meets specifications and identifying any issues before warranty expiration. Acceptance testing should verify capacity, accuracy, cycle times, energy consumption, and safety systems. Documenting baseline performance enables future condition monitoring and degradation tracking.

Training and Knowledge Transfer: Ensuring operators and maintenance personnel understand proper operation, safety procedures, basic troubleshooting, and maintenance requirements. Inadequate training contributes to 40-50% of equipment incidents in the first year of operation. Training programs should include hands-on practice, documentation review, and competency assessment.

Stage 3: Operation and Utilization

The operational phase represents 80-90% of equipment lifecycle duration and determines whether assets deliver expected value.

Performance Monitoring: Tracking equipment output, quality, efficiency, availability, and reliability metrics. Real-time monitoring systems alert operators to abnormal conditions before they cause failures. Organizations implementing condition monitoring reduce unexpected failures by 50-70% according to ARC Advisory Group research.

Utilization Management: Ensuring equipment operates at appropriate capacity levels to maximize productivity while avoiding overloading. Utilization tracking reveals that many organizations own 20-30% more equipment than necessary because they cannot effectively schedule and share assets across departments or projects.

Operator Care: Implementing autonomous maintenance where operators perform basic inspections, cleaning, lubrication, and adjustments. Operator care programs reduce maintenance workload by 15-25% while improving equipment reliability through early problem detection. World-class organizations achieve 50-60% operator involvement in routine maintenance tasks.

Energy Optimization: Monitoring and reducing equipment energy consumption through proper operation, maintenance, and efficiency upgrades. Energy represents 30-45% of lifecycle costs for motor-driven equipment. Simple measures like shutting down equipment during idle periods and maintaining proper operating conditions reduce energy consumption by 10-25%.

Stage 4: Maintenance and Repair

Maintenance activities preserve equipment condition, prevent failures, and restore performance when degradation occurs.

Preventive Maintenance: Scheduled maintenance activities performed at predetermined intervals to prevent failures and maintain performance. Preventive maintenance should be based on manufacturer recommendations, operating conditions, and historical performance data. Organizations with disciplined preventive maintenance programs achieve 97-99% planned maintenance ratios compared to 60-70% for reactive organizations.

Predictive Maintenance: Using condition monitoring technologies and data analytics to identify developing problems before they cause failures. Predictive techniques including vibration analysis, thermography, oil analysis, and ultrasound testing detect issues 30-90 days before functional failure. Predictive maintenance reduces costs by 8-12% compared to preventive maintenance while improving reliability.

Corrective Maintenance: Repairs performed after failures occur, either planned for non-critical equipment or unplanned for unexpected breakdowns. Unplanned maintenance costs 3-5 times more than planned maintenance due to emergency parts procurement, overtime labor, production losses, and secondary damage. Reducing reactive maintenance from 40% to under 20% of total maintenance delivers 15-25% cost savings.

For comprehensive maintenance strategies, see our Preventive Maintenance Article and Predictive Maintenance Article.

Maintenance Cost Optimization: A balanced maintenance strategy optimizes total costs rather than minimizing maintenance spending:

| Maintenance Strategy | % of Work | Cost per Hour | Typical Applications | |---------------------|-----------|---------------|---------------------| | Preventive (Time-based) | 35-45% | $75-125 | Non-monitored critical equipment | | Predictive (Condition-based) | 25-35% | $100-150 | Critical monitored equipment | | Corrective (Planned) | 15-25% | $125-200 | Non-critical equipment | | Reactive (Unplanned) | <10% | $250-500 | Emergency repairs only |

Stage 5: Modification and Upgrade

Equipment modification extends useful life and adapts assets to changing requirements without full replacement costs.

Performance Upgrades: Retrofitting equipment with improved components, controls, or capabilities. Control system upgrades costing $20,000-50,000 can extend equipment life by 5-10 years while improving performance, avoiding $200,000-500,000 replacement costs. Productivity improvements of 10-25% are typical for control and automation upgrades.

Technology Retrofits: Adding modern technologies like sensors, connectivity, and analytics to legacy equipment. IoT retrofits costing $5,000-15,000 per machine enable condition monitoring and predictive maintenance for equipment that would otherwise operate reactively. Payback periods average 12-24 months through avoided failures and optimized maintenance.

Capacity Modifications: Expanding or reconfiguring equipment to meet changed production requirements. Modifications cost 30-50% of new equipment prices while delivering 70-90% of the capacity increase. Modification projects typically complete in 60-80% of the time required for new equipment procurement and installation.

Compliance Upgrades: Modifications required to meet updated safety, environmental, or regulatory requirements. Rather than replacing non-compliant equipment, targeted upgrades costing 15-25% of replacement values can extend life by 5-15 years. Safety system upgrades, emissions controls, and accessibility improvements are common compliance modifications.

Stage 6: Retirement and Disposal

The final lifecycle stage involves removing equipment from service and disposing of or repurposing the asset.

End-of-Life Decision Making: Determining optimal retirement timing based on condition assessment, maintenance costs, obsolescence, and replacement options. Equipment should be retired when annual operating and maintenance costs exceed 15-20% of replacement value, or when reliability drops below acceptable thresholds. Organizations tracking equipment condition make retirement decisions 12-24 months in advance, allowing planned replacements rather than emergency purchases.

Disposal Options: Selecting appropriate disposal methods including resale, auction, trade-in, recycling, or scrapping. Residual values range from 5-25% of original cost depending on equipment type, condition, and market demand. Heavy equipment and vehicles retain higher resale values (15-25%) while specialized machinery may only achieve scrap value (2-5%).

Environmental Compliance: Managing hazardous materials, fluids, and components according to environmental regulations. Non-compliance penalties range from $10,000-100,000+ per violation. Proper disposal documentation protects against future liability claims and demonstrates environmental stewardship.

Knowledge Capture: Documenting equipment history, performance patterns, failure modes, and lessons learned to inform future acquisition and management decisions. Failure mode and effects analysis (FMEA) from retiring equipment improves specifications for replacement assets, avoiding repeated problems and reducing lifecycle costs by 8-15%.

For more on lifecycle management, see our Asset Lifecycle Management guide.
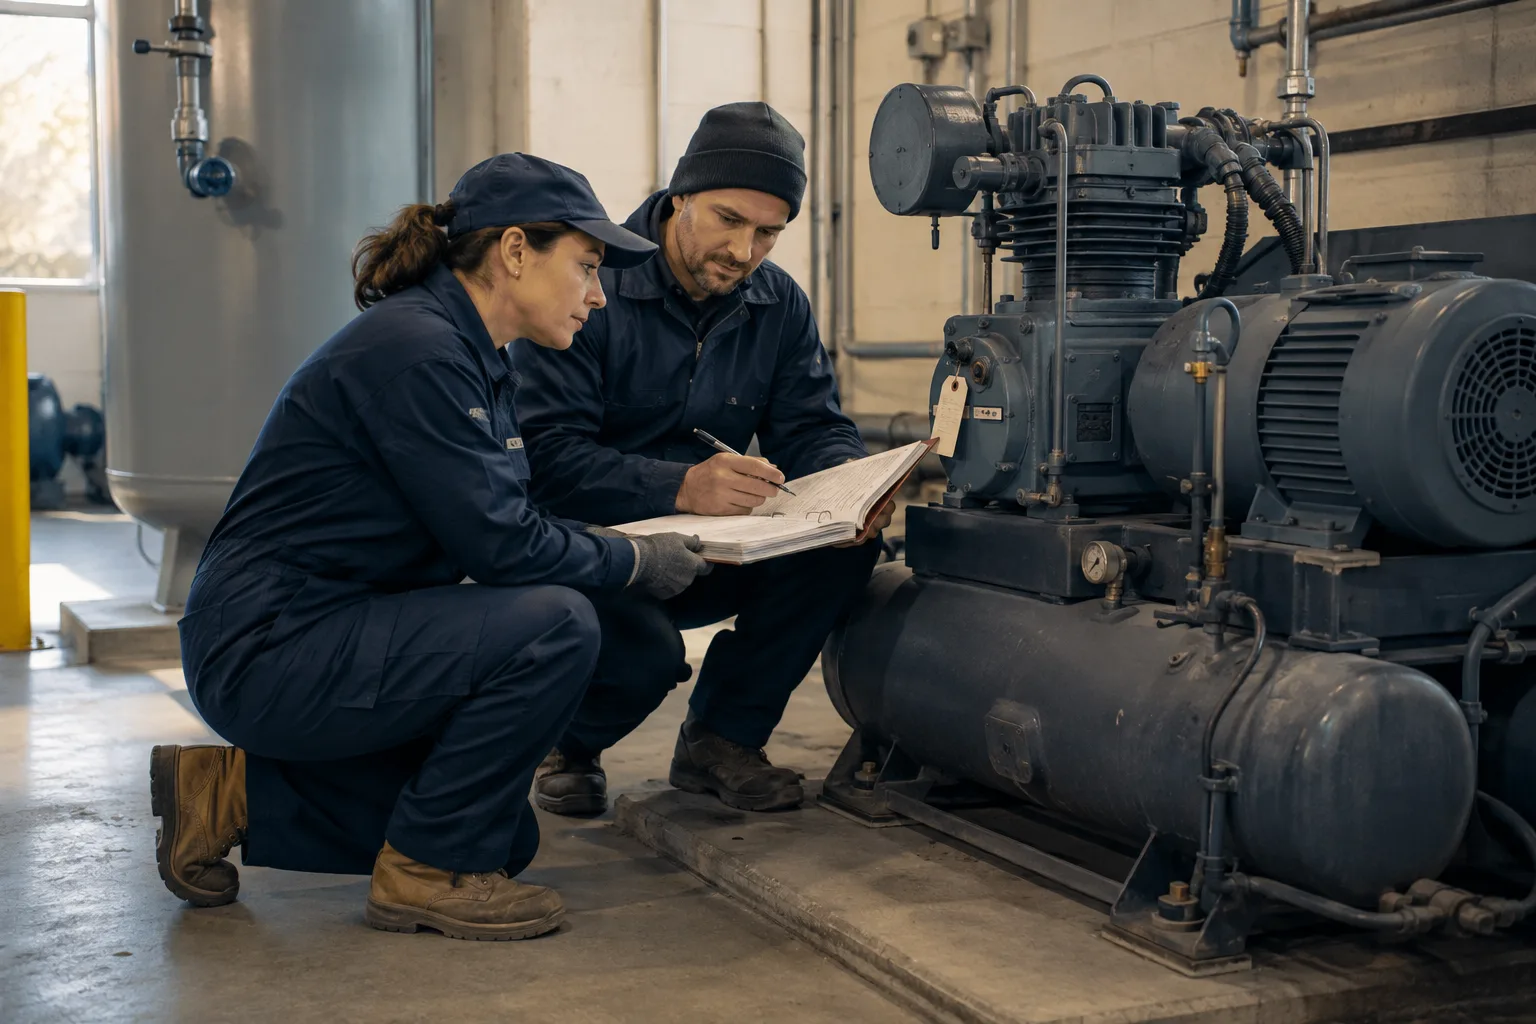
Key Components of Equipment Asset Management Systems

Comprehensive equipment asset management requires integrated systems and processes covering multiple functional areas.

Asset Registry and Documentation

The foundation of EAM is accurate, complete asset information accessible to everyone who needs it.

Asset Identification: Unique identification systems using asset numbers, barcode labels, RFID tags, or QR codes. Proper identification enables quick equipment location, history access, and maintenance tracking. Organizations without systematic identification spend 15-25% of maintenance time locating equipment, obtaining records, and identifying parts requirements.

Asset Hierarchies: Logical organization structures grouping equipment by location, type, system, or function. Hierarchies enable reporting at various levels (facility, production line, system, component) and inheritance of attributes like maintenance plans or cost centers. Well-designed hierarchies reduce setup time for new assets by 40-60% through template application.

Technical Documentation: Centralized storage for manuals, drawings, specifications, procedures, and technical data. Digital documentation systems reduce document access time from 15-30 minutes to under 2 minutes, saving 8-12% of maintenance labor. Mobile access to procedures and diagrams improves first-time fix rates by 20-30%.

Asset Attributes: Comprehensive data fields capturing equipment characteristics, specifications, relationships, and business information:

| Attribute Category | Key Data Elements | Business Value | |-------------------|-------------------|----------------| | Identification | Asset number, serial number, manufacturer, model | Unique identification, parts ordering | | Location | Site, building, area, system | Physical location, work planning | | Technical | Specifications, capacity, rated power, dimensions | Operating parameters, compatibility | | Financial | Purchase cost, depreciation, book value, cost center | Financial reporting, capitalization | | Maintenance | Criticality, PM schedules, spare parts, procedures | Maintenance planning, resource allocation | | Performance | OEE, MTBF, MTTR, availability | Reliability improvement, benchmarking | | Compliance | Certifications, inspection schedules, regulations | Safety, regulatory compliance |

Work Order Management

Structured processes for planning, scheduling, executing, and documenting maintenance activities.

Work Request Processing: Capturing maintenance needs from operators, inspections, or condition monitoring. Formal work request systems ensure problems are documented and prioritized rather than handled through informal communication that causes 20-30% of needs to be forgotten or delayed. Digital request systems reduce request-to-work-order time from 3-5 days to under 24 hours.

Planning and Preparation: Defining work scope, estimating resources, identifying parts and materials, developing procedures, and assessing risks. Proper planning improves technician efficiency by 25-40% through reduced waiting time, fewer return visits, and optimized task sequences. Organizations allocating 20-30% of maintenance resources to planning achieve 15-25% overall cost reductions.

Scheduling Optimization: Coordinating maintenance activities with production schedules, resource availability, and asset priorities. Schedule compliance above 90% indicates effective coordination between maintenance and operations. Poor scheduling causes 30-40% of maintenance time to be wasted on waiting, travel, and starting/stopping work.

Execution Tracking: Recording actual labor, materials, findings, and actions taken during maintenance activities. Complete work documentation enables failure analysis, cost tracking, and performance improvement. Organizations capturing detailed execution data improve repeat failure resolution by 35-45% through better root cause analysis.

For comprehensive work management strategies, see our Maintenance Planning and Scheduling Guide.

Inventory and Parts Management

Maintaining appropriate spare parts inventories to support equipment maintenance without excessive carrying costs.

Criticality-Based Stocking: Determining which parts to stock based on equipment criticality, lead times, failure rates, and costs. Critical spares for equipment with long lead times or high downtime costs should be stocked even if rarely used. Optimized inventory strategies reduce inventory carrying costs by 20-35% while improving parts availability from 85-90% to 95-98%.

Min-Max Inventory Control: Establishing reorder points and quantities based on usage rates, lead times, and service level targets. Automated reorder systems reduce stockouts by 40-60% while preventing excess inventory accumulation. Average inventory values decrease 15-25% through systematic controls.

Parts Interchangeability: Standardizing equipment and components to maximize parts sharing across multiple assets. Each unique part number adds $500-1,500 in annual carrying costs. Reducing unique parts by 20-30% through standardization delivers $50,000-200,000 in annual inventory savings for typical industrial facilities.

Supplier Management: Qualifying reliable vendors, negotiating framework agreements, and managing supplier performance. Lead time reduction from 4-8 weeks to 1-2 weeks through supplier partnerships reduces required safety stock by 30-50%. Consignment inventory arrangements eliminate 15-25% of inventory carrying costs by transferring ownership to suppliers until parts are used.

Preventive and Predictive Maintenance

Proactive maintenance strategies prevent failures and optimize maintenance timing.

PM Program Development: Creating maintenance task lists, frequencies, and procedures based on manufacturer recommendations, operating conditions, and failure history. Effective PM programs prevent 60-80% of potential equipment failures. Task optimization eliminates 15-25% of non-value-added PM activities while improving reliability through better task selection.

Condition Monitoring: Using technologies like vibration analysis, thermography, oil analysis, motor current signature analysis, and ultrasound to assess equipment health. Condition monitoring detects developing problems 30-180 days before functional failure, enabling planned repairs during scheduled downtime. ROI for monitoring programs ranges from 300-800% according to Reliabilityweb.com research.

Predictive Analytics: Applying machine learning and statistical models to predict equipment failures, optimize maintenance timing, and prioritize resources. Predictive models achieve 85-92% accuracy in forecasting failures 7-21 days in advance for rotating equipment. Each prevented unplanned failure saves $5,000-50,000 depending on equipment criticality and production impact.

Reliability-Centered Maintenance (RCM): Systematic methodology for determining optimal maintenance strategies based on equipment function, failure modes, and consequences. RCM analysis reduces maintenance costs by 20-35% while improving reliability through better resource allocation. Organizations applying RCM principles achieve 2-4 year payback periods on analysis investments.

Performance and Condition Tracking

Continuous monitoring of equipment health, performance, and reliability metrics.

Key Performance Indicators: Tracking metrics that indicate equipment effectiveness and maintenance program health:

| Metric Category | Key Indicators | World-Class Targets | |----------------|----------------|---------------------| | Equipment Performance | OEE, Availability, Performance Rate, Quality Rate | 85%+, 95%+, 95%+, 99%+ | | Reliability | MTBF, MTTR, Equipment Uptime | 180+ days, <4 hours, 97%+ | | Maintenance Efficiency | PM Compliance, Schedule Compliance, Wrench Time | 95%+, 90%+, 55%+ | | Maintenance Strategy | % Preventive, % Predictive, % Reactive | 45%+, 30%+, <10% | | Cost Performance | Maintenance Cost/RAV, Cost per Unit Produced | <3%, Decreasing trend | | Parts Management | Inventory Turns, Parts Availability, Stockouts | 2-4x, 98%+, <2% |

Trend Analysis: Identifying patterns in equipment performance, failure rates, and maintenance costs to detect degradation and prioritize improvement efforts. Statistical process control charts reveal when equipment performance exceeds normal variation, triggering investigation before failures occur. Organizations analyzing trends proactively prevent 25-40% more failures than those using simple threshold alarms.

Benchmarking: Comparing equipment and maintenance performance against internal targets, similar facilities, or industry standards. Benchmarking identifies performance gaps and improvement opportunities. Organizations participating in industry benchmarking consortiums achieve 8-15% better performance than isolated organizations through best practice sharing.

Failure Analysis: Investigating equipment failures to determine root causes and prevent recurrence. Rigorous failure analysis using methods like FMEA, fault tree analysis, and root cause analysis reduces repeat failures by 50-70%. Each prevented repeat failure saves investigation and repair costs while avoiding production losses.

For asset tracking strategies, see our Asset Tracking Software guide.

Financial Management

Tracking equipment costs, optimizing investments, and demonstrating value.

Cost Tracking: Recording all equipment-related expenditures including purchases, maintenance, energy, and downtime. Complete cost tracking reveals that actual ownership costs often exceed estimates by 30-50%, enabling better future decisions. Cost per operating hour or per unit produced provides actionable metrics for optimization.

Budget Management: Planning and controlling maintenance spending aligned with asset strategies and business objectives. Organizations with formal maintenance budgeting processes achieve 90-95% budget accuracy compared to 60-75% for those without structured planning. Variance analysis identifies opportunities for cost reduction and efficiency improvement.

Depreciation and Valuation: Tracking asset book values, accumulated depreciation, and current replacement values. Accurate asset registers support financial reporting, insurance coverage, and capital planning. Many organizations discover 15-25% of their asset registers contain obsolete or disposed equipment, overstating balance sheets and insurance premiums.

Return on Investment Analysis: Evaluating maintenance investments, equipment purchases, and improvement projects based on financial returns. ROI calculations for maintenance programs typically show 200-500% returns through avoided downtime, extended asset life, and reduced emergency repairs. Capital equipment decisions should include lifecycle cost projections showing total financial impact.

Compliance and Safety Management

Ensuring equipment meets regulatory requirements and operates safely.

Regulatory Compliance: Tracking and executing required inspections, certifications, and documentation for regulated equipment. Compliance management prevents penalties averaging $25,000-100,000 per violation and reduces liability exposure. Automated compliance tracking reduces missed inspections by 80-95% compared to manual systems.

Safety Program Integration: Incorporating equipment safety requirements into maintenance procedures, including lockout/tagout, confined space entry, hot work permits, and personal protective equipment. Equipment-related incidents cause 20-30% of workplace injuries. Integrating safety protocols into work orders reduces incident rates by 30-50% through consistent application.

Environmental Management: Tracking and controlling equipment emissions, discharges, and environmental impacts. Monitoring systems detect exceedances and trigger corrective actions before violations occur. Proactive environmental management avoids penalties and reduces remediation costs by 40-60% through early intervention.

Audit and Documentation: Maintaining records demonstrating compliance with regulations, standards, and internal policies. Digital documentation systems reduce audit preparation time by 60-80% and improve audit results through complete, organized records. Organizations with robust documentation systems experience 50-70% fewer compliance findings during audits.

Equipment Management vs Asset Management vs CMMS: Understanding the Differences

The terms equipment management, asset management, and CMMS are often used interchangeably, but they represent different scopes and capabilities.

Equipment Asset Management (EAM)

Equipment asset management focuses specifically on physical equipment throughout its lifecycle, emphasizing maintenance, performance, and lifecycle optimization.

EAM Scope: Physical equipment including machinery, vehicles, tools, and building systems. EAM systems track equipment from acquisition through disposal, managing maintenance activities, performance metrics, and lifecycle costs. EAM is the most comprehensive approach for organizations where equipment represents significant operational and financial investments.

Core EAM Capabilities: Maintenance management, asset tracking, work order management, preventive and predictive maintenance, parts inventory, performance monitoring, compliance tracking, and lifecycle cost analysis. Leading EAM systems integrate with condition monitoring, business intelligence, and enterprise systems.

EAM Best Fits: Manufacturing operations, utility companies, transportation fleets, construction contractors, facility management, and healthcare organizations where equipment reliability directly impacts operations and service delivery. Organizations with equipment values exceeding $10 million and maintenance budgets above $1 million achieve the strongest EAM benefits.

Asset Management (Broader Definition)

Asset management in its broader sense encompasses all organizational assets including physical equipment, facilities, infrastructure, IT systems, and financial assets.

Asset Management Scope: Comprehensive management of all asset types aligned with organizational strategy, risk tolerance, and stakeholder requirements. The international standard ISO 55000 defines asset management as "coordinated activity of an organization to realize value from assets." This includes equipment but extends to facilities, infrastructure, technology, intellectual property, and human resources.

Strategic Focus: Asset management emphasizes strategic alignment, risk management, lifecycle value optimization, and stakeholder communication at the organizational level. It addresses questions like: What assets do we need to deliver organizational objectives? How do we optimize the asset portfolio? What risks do we face? How do we demonstrate stewardship?

Implementation Framework: Organizations implementing ISO 55000 asset management develop asset management policies, strategies, objectives, and plans covering their entire asset portfolio. This enterprise-wide approach typically requires 12-24 months to implement and achieves 15-25% improvements in asset-related return on investment.

For comprehensive asset management frameworks, see our Asset Management Guide.

Computerized Maintenance Management Systems (CMMS)

CMMS represents the software systems used to execute maintenance management, forming a component of complete EAM solutions.

CMMS Scope: Software applications managing maintenance work orders, preventive maintenance scheduling, parts inventory, and maintenance history. CMMS focuses on operational execution rather than strategic lifecycle management. CMMS is the engine that runs day-to-day maintenance operations.

Core CMMS Functions: Work order creation and tracking, preventive maintenance scheduling, parts and inventory management, labor tracking, maintenance history, and basic reporting. Modern CMMS solutions include mobile access, barcode scanning, and integration capabilities.

CMMS Evolution: Traditional CMMS systems addressed maintenance execution only, while modern solutions have expanded to include asset registers, condition monitoring integration, and analytics capabilities. Cloud-based CMMS solutions reduce implementation time from 4-6 months to 4-8 weeks and eliminate infrastructure requirements.

For detailed CMMS information, see our CMMS Complete Guide.

Comparison Matrix: EAM vs Asset Management vs CMMS

| Dimension | Equipment Asset Management (EAM) | Asset Management (ISO 55000) | CMMS | |-----------|----------------------------------|------------------------------|------| | Primary Focus | Equipment lifecycle optimization | Strategic asset value realization | Maintenance execution | | Scope | Physical equipment assets | All organizational assets | Maintenance operations | | Time Horizon | Complete equipment lifecycle (10-30 years) | Long-term strategic (5-20+ years) | Operational (days to months) | | Key Activities | Acquisition, operation, maintenance, disposal | Strategy, policy, planning, optimization | Work orders, PM, parts, labor | | Decision Level | Tactical and operational | Strategic and tactical | Operational | | Users | Maintenance, operations, engineering, finance | Executive, asset managers, planners | Maintenance technicians, supervisors | | Financial Focus | Lifecycle cost, TCO, asset ROI | Portfolio optimization, value creation | Maintenance budgets, cost control | | Integration Needs | ERP, procurement, condition monitoring | Enterprise strategy, financial systems | Limited - work execution systems | | Implementation Complexity | High (6-12 months) | Very High (12-24 months) | Medium (2-6 months) | | Typical Investment | $150K-$1M+ | $500K-$5M+ | $25K-$250K | | ROI Timeline | 12-24 months | 24-36 months | 6-12 months | | Best For | Equipment-intensive operations | Large, complex organizations | Maintenance departments |

Integrated Approach

The most effective organizations integrate these approaches rather than choosing one over another.

CMMS as Foundation: Implementing robust CMMS capabilities provides the operational execution platform and data foundation. Organizations should achieve 90%+ CMMS adoption and data accuracy before pursuing advanced EAM or asset management initiatives. This typically requires 6-12 months of focused change management and process improvement.

EAM for Equipment Optimization: Building EAM capabilities on the CMMS foundation adds lifecycle management, performance optimization, and strategic equipment decisions. EAM implementation extends CMMS investments by adding asset registers, condition monitoring integration, lifecycle costing, and advanced analytics.

Asset Management for Strategic Alignment: Adopting ISO 55000 asset management principles provides the strategic framework connecting equipment management to organizational objectives. Organizations with mature CMMS and EAM capabilities can implement asset management frameworks in 12-18 months, while those starting from scratch require 24-36 months.

Implementation Sequence: The most successful path follows CMMS implementation (0-6 months), CMMS optimization (6-18 months), EAM expansion (12-24 months), and asset management framework adoption (24-36 months). This staged approach delivers value at each phase while building capabilities for the next level.

Equipment Tracking and Monitoring Technologies

Modern technologies enable real-time visibility into equipment location, condition, and performance.

Location Tracking Technologies

Knowing where equipment is located seems basic, but many organizations waste 15-25% of equipment time searching for assets.

Barcode Systems: Cost-effective identification using printed barcode labels and handheld scanners. Barcode systems cost $3,000-10,000 to implement for 500-1000 assets and provide 98%+ scan accuracy. Limitations include line-of-sight requirements and manual scanning dependency. Best for fixed equipment in controlled environments.

RFID Tracking: Radio frequency identification using passive or active tags readable from inches to hundreds of feet. Passive RFID costs $0.50-3 per tag with readers at $500-2,000, enabling automated tracking without manual scanning. Active RFID costs $15-75 per tag but provides real-time location tracking across facilities. RFID systems reduce equipment location time by 80-95%.

GPS Tracking: Global positioning systems for mobile equipment operating across multiple sites. GPS tracking costs $15-40 per asset monthly and provides location accuracy within 3-10 meters. Fleet management systems combine GPS with telematics, providing location, utilization, fuel consumption, and operator behavior data. GPS tracking improves equipment utilization by 15-30% through better visibility and scheduling.

BLE and IoT Beacons: Bluetooth Low Energy beacons provide indoor location tracking where GPS signals are unavailable. Beacons cost $10-30 each with battery life of 1-3 years. Indoor positioning systems achieve 1-5 meter accuracy using multiple beacons. Best for equipment moving within facilities but requiring location tracking for utilization or security.

Technology Selection Factors:

| Technology | Cost per Asset | Range | Accuracy | Battery Life | Best Applications | |------------|---------------|-------|----------|--------------|-------------------| | Barcode | $1-5 | Line of sight | 98%+ | N/A | Fixed equipment, controlled access | | Passive RFID | $3-8 | 1-20 feet | 95%+ | 10+ years | Automatic identification, checkpoints | | Active RFID | $25-75 | 100-500 feet | 3-10 meters | 2-5 years | Real-time indoor location tracking | | GPS | $20-60/month | Global | 3-10 meters | Powered | Mobile equipment, outdoor operations | | BLE Beacons | $15-40 | 30-100 feet | 1-5 meters | 1-3 years | Indoor location, proximity detection |

Condition Monitoring Technologies

Condition monitoring technologies detect developing equipment problems before functional failures occur.

Vibration Analysis: Measuring and analyzing vibration patterns to detect bearing wear, unbalance, misalignment, and mechanical looseness in rotating equipment. Vibration monitoring detects problems 30-90 days before failure with 85-95% accuracy. Portable analyzers cost $5,000-20,000, while permanent monitoring systems cost $2,000-8,000 per measurement point. Organizations implementing vibration programs reduce unplanned downtime by 30-50%.

Thermography: Using infrared cameras to detect abnormal temperature patterns indicating electrical problems, mechanical friction, insulation failure, or process issues. Thermography surveys identify problems 30-180 days before failure. Thermal cameras cost $3,000-50,000 depending on resolution and features. Thermography inspections cost $500-2,000 per day for external services or $50,000-150,000 annually for in-house programs covering 500-2000 assets.

Oil Analysis: Testing lubricant samples for wear metals, contamination, and lubricant degradation to assess internal equipment condition. Oil analysis detects wear 60-180 days before functional failure and optimizes oil change intervals. Testing costs $15-50 per sample with 5-10 day turnaround. Organizations using oil analysis extend lubricant life by 30-50% and reduce oil-related failures by 40-60%.

Ultrasound Testing: Detecting high-frequency sounds indicating air leaks, steam trap failures, bearing lubrication issues, and electrical arcing. Ultrasound equipment costs $3,000-15,000 and detects problems 10-90 days before failure. Ultrasound is particularly effective for compressed air systems, identifying leaks causing 20-30% energy waste in typical facilities.

Motor Current Signature Analysis (MCSA): Analyzing motor electrical characteristics to detect rotor bar problems, bearing issues, phase imbalances, and load conditions. MCSA monitoring costs $1,000-5,000 per motor and provides continuous assessment without mechanical sensors. Particularly effective for critical motors driving pumps, fans, and compressors.

Condition Monitoring ROI: A comprehensive condition monitoring program costs $50-150 per monitored asset annually but delivers 300-800% ROI through avoided failures. For a typical industrial facility:

  • Investment: $150,000 for condition monitoring program covering 1,000 critical assets
  • Annual Operating Cost: $50,000 for testing, analysis, and program management
  • Avoided Failures: 25-40 prevented unplanned failures annually
  • Cost per Avoided Failure: $15,000 average including repairs, downtime, and lost production
  • Annual Benefit: $375,000-600,000
  • Net Annual Benefit: $325,000-550,000
  • ROI: 160-270% annually, payback in 4-7 months

Performance Monitoring and IoT

Internet of Things (IoT) technologies enable real-time equipment performance monitoring and analytics.

IoT Sensors: Low-cost sensors measuring temperature, pressure, flow, vibration, current, and other parameters. Industrial IoT sensors cost $50-500 each with wireless connectivity and battery life of 1-5 years. Organizations instrumenting critical equipment with IoT sensors achieve 30-50% reductions in unplanned downtime through early problem detection.

Edge Computing: Processing sensor data locally at or near equipment rather than transmitting all data to central systems. Edge devices cost $200-2,000 each but reduce communication costs by 60-80% and enable real-time decision-making. Edge computing is essential for high-frequency data collection (100+ samples per second) used in advanced vibration and process monitoring.

Cloud Analytics Platforms: Centralized platforms aggregating data from multiple sites and equipment types, applying machine learning models to predict failures and optimize operations. Cloud analytics platforms cost $5,000-50,000 annually depending on equipment count and functionality. These platforms democratize predictive analytics, enabling small and medium organizations to benefit from technologies previously available only to large enterprises.

Digital Twins: Virtual models simulating equipment performance, predicting behavior under various conditions, and optimizing operations. Digital twins require significant modeling effort but enable scenario testing, operator training, and optimization without impacting physical assets. Organizations implementing digital twins for critical equipment report 10-20% performance improvements and 15-25% maintenance cost reductions.

OEE and Production Monitoring: Real-time tracking of Overall Equipment Effectiveness, downtime reasons, production counts, and quality metrics. OEE monitoring systems cost $2,000-10,000 per production line and increase equipment effectiveness by 5-15 percentage points through better visibility and problem-solving focus. Each OEE percentage point improvement generates $100,000-500,000 in annual value for typical manufacturing lines.

Integration and Data Management

The value of monitoring technologies multiplies when data flows seamlessly into EAM systems and business processes.

System Integration: Connecting condition monitoring systems, IoT platforms, and production monitoring to EAM/CMMS systems for automated work order creation and maintenance optimization. Integration projects cost $25,000-150,000 but reduce manual data entry by 70-90% and enable automated alerting and work order generation.

Data Quality Management: Establishing processes ensuring sensor calibration, data validation, and accurate asset associations. Poor data quality undermines analytics and causes 30-50% of alerts to be false positives. Organizations achieving 95%+ data quality see 3-4x higher value from monitoring investments than those with 70-80% data quality.

Analytics and Visualization: Creating dashboards, reports, and analytics enabling operations and maintenance personnel to make data-driven decisions. Self-service analytics tools costing $10,000-100,000 annually enable users to create custom views without IT support. Organizations with effective visualization achieve 25-40% faster problem resolution through better information access.

Mobile Access: Providing technicians mobile access to equipment data, monitoring results, procedures, and documentation. Mobile solutions reduce information access time from 15-30 minutes to under 2 minutes, improving technician efficiency by 10-20%. Mobile work order systems improve data capture, reducing missing information from 30-40% to under 5%.

Preventive and Predictive Maintenance Strategies for Equipment

Maintenance strategy selection dramatically impacts equipment reliability, costs, and lifecycle value.

Maintenance Strategy Framework

Different equipment types and business contexts require different maintenance approaches.

Run-to-Failure: Allowing equipment to operate until failure occurs, then performing corrective repairs. Appropriate for non-critical equipment with low failure consequences, redundant assets, or situations where preventive maintenance costs exceed failure costs. Run-to-failure typically applies to 20-30% of equipment assets. Example: light bulbs, low-cost hand tools, and redundant pumps with automated backups.

Preventive Maintenance: Performing scheduled maintenance activities at predetermined intervals to prevent failures. Preventive strategies work well for equipment with age-related failure patterns and reasonable maintenance costs. Organizations should apply preventive maintenance to 35-45% of assets, focusing on equipment where failures impact safety, production, or quality. Example: lubrication, filter changes, alignment checks, and component replacements at recommended intervals.

Predictive Maintenance: Using condition monitoring and analytics to identify developing problems and optimize maintenance timing. Predictive approaches suit expensive, critical equipment where monitoring costs are justified by failure consequences. Predictive maintenance typically applies to 25-35% of assets representing the highest criticality and value. Example: vibration monitoring on critical motors, oil analysis on expensive gearboxes, and thermography on electrical distribution systems.

Proactive Maintenance: Identifying and eliminating root causes of equipment failures to prevent problems from occurring. Proactive strategies include precision installation, contamination control, operating condition optimization, and design improvements. Organizations achieving world-class reliability apply proactive maintenance principles to 100% of assets while using reactive, preventive, or predictive strategies for ongoing maintenance. Example: precision alignment during installation, contamination exclusion systems for hydraulics, and operating procedure optimization to prevent equipment abuse.

Maintenance Strategy Selection Matrix

Choosing appropriate maintenance strategies based on equipment characteristics and business factors:

| Equipment Characteristics | Recommended Strategy | Justification | |--------------------------|---------------------|----------------| | Critical, high downtime cost, monitorable | Predictive | Monitoring cost justified by failure consequences | | Critical, high downtime cost, not monitorable | Preventive | Scheduled maintenance prevents costly failures | | Critical, constant failure rate | Proactive + Run-to-Failure | Address root causes, backup systems for coverage | | Non-critical, age-related failures | Preventive (interval-based) | Simple scheduled maintenance prevents failures | | Non-critical, random failures | Run-to-Failure | Maintenance costs exceed failure costs | | Regulated equipment (safety, compliance) | Preventive (at minimum) | Regulatory requirements drive maintenance | | New/warranty equipment | Preventive per manufacturer | Manufacturer requirements, warranty protection | | Aging equipment near replacement | Run-to-Failure or Minimal PM | Avoid spending on assets being replaced |

Optimizing Preventive Maintenance Programs

Many organizations perform 20-40% more preventive maintenance than necessary, wasting resources on non-value-added tasks.

Task Optimization: Reviewing each preventive maintenance task to determine if it prevents failures, detects problems, or provides no value. Studies show that 15-30% of PM tasks can be eliminated without affecting reliability. Task optimization processes evaluate manufacturer recommendations, failure history, operating conditions, and task effectiveness. Organizations completing PM optimization reduce maintenance labor by 12-20% while improving reliability through better resource allocation.

Frequency Optimization: Adjusting maintenance intervals based on operating conditions, failure patterns, and condition monitoring results. Many manufacturers recommend conservative intervals assuming worst-case conditions. Extending PM frequencies for equipment operating in favorable conditions reduces labor and parts costs by 10-25% without increasing failure rates. Conversely, accelerating PM for equipment in harsh conditions prevents 20-40% more failures.

Condition-Based Task Intervals: Transitioning from fixed time intervals to condition-based triggering when monitoring technology is available. Condition-based maintenance extends intervals by 20-50% while improving reliability through better timing. Organizations implementing condition-based maintenance reduce preventive maintenance costs by 15-25% while decreasing unexpected failures by 25-40%.

Predictive Task Substitution: Replacing invasive preventive maintenance tasks with non-invasive predictive monitoring. For example, substituting bearing replacements every 24 months with vibration monitoring reduces maintenance costs by $500-2,000 per asset annually while improving reliability through better replacement timing. Predictive substitution typically reduces specific maintenance costs by 40-60% while improving equipment availability.

Implementing Predictive Maintenance Programs

Predictive maintenance delivers the highest reliability and lowest lifecycle costs for critical equipment but requires systematic implementation.

Asset Prioritization: Selecting equipment for predictive monitoring based on criticality, failure consequences, and monitoring technology availability. The Pareto principle applies - 20-30% of assets typically account for 70-80% of downtime and maintenance costs. Organizations should focus predictive efforts on this critical minority. A typical prioritization scores assets on production impact (1-10), safety risk (1-10), downtime cost ($), and monitoring feasibility (high/medium/low).

Technology Selection: Matching monitoring technologies to equipment types and failure modes:

| Equipment Type | Primary Failure Modes | Recommended Technologies | Detection Window | |----------------|----------------------|-------------------------|------------------| | Rotating Equipment | Bearings, unbalance, misalignment | Vibration analysis, oil analysis | 30-90 days | | Electrical Systems | Connections, insulation, overload | Thermography, MCSA | 30-180 days | | Hydraulic Systems | Contamination, component wear | Oil analysis, filter inspection | 60-180 days | | Compressed Air Systems | Leaks, moisture, contamination | Ultrasound, dew point monitoring | 10-60 days | | Heat Exchangers | Fouling, corrosion, leaks | Performance monitoring, ultrasound | 30-120 days | | Motors and Drives | Bearings, rotor bars, insulation | Vibration, MCSA, thermography | 30-90 days |

Baseline Development: Establishing normal operating signatures and alarm thresholds for each monitored asset. Baseline development requires 30-90 days of data collection under various operating conditions. Organizations skipping proper baselining experience 40-60% false alarm rates that undermine program credibility and waste resources investigating normal conditions.

Data Analysis and Interpretation: Developing expertise to interpret monitoring data and make accurate recommendations. Analysis capabilities determine program value - excellent sensors with poor analysis deliver minimal benefit. Organizations should invest in analyst training ($3,000-10,000 per person annually), external expertise during startup ($20,000-50,000), and analysis software tools ($5,000-25,000 annually).

Action Management: Creating processes ensuring monitoring findings trigger timely maintenance actions. The weakest point in many predictive programs is the gap between problem detection and maintenance execution. Organizations should establish automated work order creation from monitoring systems, regular condition monitoring meetings reviewing findings, and escalation processes for critical issues.

Program Measurement: Tracking predictive maintenance program performance including detected problems, avoided failures, false alarms, maintenance cost changes, and reliability improvements. Successful programs prevent 25-50 failures annually for every 100 monitored assets, with average value of $10,000-30,000 per avoided failure. Programs not measuring value struggle to justify continued investment.

Reliability-Centered Maintenance (RCM)

RCM is a systematic methodology for determining optimal maintenance strategies based on equipment functions, failure modes, and consequences.

RCM Process Overview: RCM analysis follows a structured approach: (1) Identify equipment functions and performance standards, (2) Determine how equipment can fail to perform functions, (3) Identify causes of each failure mode, (4) Determine consequences of each failure, (5) Select applicable and effective maintenance tasks, (6) Document maintenance strategies, (7) Implement and optimize tasks.

Failure Mode and Effects Analysis (FMEA): Systematically identifying potential failures, their causes, effects, and current controls. FMEA scoring evaluates severity (1-10), occurrence probability (1-10), and detection difficulty (1-10), calculating a Risk Priority Number (RPN = Severity x Occurrence x Detection). Failure modes with RPN > 100-125 typically warrant proactive maintenance strategies.

Maintenance Task Selection: RCM evaluates maintenance tasks against specific criteria: Is the task applicable (does it address the failure mode)? Is it effective (will it prevent or detect the failure)? Is it cost-effective (do benefits exceed costs)? RCM analysis often reveals that 30-40% of traditional PM tasks fail these criteria and should be eliminated or modified.

RCM Benefits and Investment: RCM analysis requires significant effort - 40-80 hours per system analyzed - but delivers 200-400% ROI through optimized maintenance strategies. Organizations implementing RCM achieve 20-35% maintenance cost reductions, 15-25% reliability improvements, and 10-20% increased equipment capacity. RCM is most valuable for complex systems where maintenance costs exceed $500,000 annually or where reliability directly impacts safety or production.

Equipment Performance Optimization

Beyond preventing failures, leading organizations optimize equipment performance to maximize productivity, quality, and efficiency.

Overall Equipment Effectiveness (OEE)

OEE is the gold standard metric for equipment performance, measuring how effectively equipment converts time into valuable output.

OEE Calculation: OEE combines three factors: Availability (actual operating time / planned operating time), Performance (actual output / theoretical maximum output), and Quality (good output / total output). OEE = Availability x Performance x Quality. For example: 90% availability x 85% performance x 98% quality = 75% OEE.

World-Class OEE Targets: Manufacturing best practice targets include:

  • World-Class OEE: 85%+ (achieved by top 10% of facilities)
  • Good OEE: 70-85% (better than average, room for improvement)
  • Average OEE: 60-70% (typical for many industries)
  • Low OEE: <60% (significant improvement opportunity)

Each 1% OEE improvement generates $100,000-500,000 in annual value for typical manufacturing operations through increased capacity without capital investment.

OEE Loss Categories: Understanding the six big losses that reduce OEE:

| Loss Category | Impact Factor | Typical % of Total Loss | Improvement Strategies | |---------------|---------------|------------------------|------------------------| | Breakdowns/Failures | Availability | 10-25% | Preventive/predictive maintenance, reliability improvement | | Setup/Changeovers | Availability | 15-30% | SMED techniques, standardization, scheduling | | Small Stops | Performance | 15-25% | Root cause analysis, minor stop elimination, sensor adjustment | | Reduced Speed | Performance | 10-20% | Process optimization, wear prevention, operator training | | Startup Rejects | Quality | 8-15% | Procedure optimization, automated setup verification | | Production Rejects | Quality | 10-20% | Process control, quality systems, capability improvement |

OEE Improvement Programs: Systematic approaches to improving OEE achieve 10-20 percentage point gains over 12-24 months:

Phase 1 (Months 1-3): Establish accurate OEE measurement and baseline performance. Many organizations discover their actual OEE is 10-20 points lower than believed due to measurement gaps. Implement real-time OEE monitoring and downtime reason tracking.

Phase 2 (Months 4-9): Address the biggest losses through focused improvement projects. Pareto analysis typically reveals that 20% of downtime causes account for 70-80% of total losses. Quick wins come from eliminating frequent minor stops and addressing chronic equipment issues.

Phase 3 (Months 10-18): Implement sustainable improvement processes including autonomous maintenance, planned maintenance optimization, and focused improvement teams. Embed OEE review into daily management routines.

Phase 4 (Months 19-24): Expand to quality losses, process optimization, and capability improvement. Address more complex technical challenges requiring engineering or capital investment.

Throughput and Capacity Optimization

Maximizing equipment output within quality and sustainability constraints.

Bottleneck Management: Identifying and optimizing constraint equipment limiting overall system capacity. Theory of Constraints teaches that improving non-bottleneck equipment provides no system benefit while improving bottleneck equipment multiplies throughout the entire operation. Organizations focusing improvement efforts on the system constraint achieve 10-25% capacity increases without capital investment.

Changeover Reduction: Minimizing time required to switch equipment from one product to another. Single-Minute Exchange of Die (SMED) techniques reduce changeover times by 40-75% through preparation, standardization, and process optimization. For equipment with 4-6 hour changeovers, SMED reductions create 10-20% capacity increases while enabling smaller batch sizes and better customer responsiveness.

Production Scheduling Optimization: Coordinating production sequences to minimize changeovers, balance workload, and match equipment capabilities to product requirements. Advanced planning and scheduling (APS) systems improve equipment utilization by 8-15% through better sequence optimization. Organizations implementing pull scheduling systems (kanban, just-in-time) reduce work-in-process inventory by 30-50% while improving equipment utilization.

Parallel and Flexible Operations: Configuring multiple equipment resources to enable parallel processing and flexibility to handle demand variation. Equipment flexibility investments typically cost 10-20% of asset value but enable 20-40% better capacity utilization through work balancing. Flexibility is particularly valuable in high-mix, low-volume operations where dedicated equipment would be underutilized.

Energy and Resource Efficiency

Equipment energy consumption represents 30-45% of lifecycle costs for motor-driven equipment.

Energy Monitoring and Management: Measuring equipment energy consumption enables identification of efficiency opportunities. Equipment-level metering costs $500-3,000 per asset but typically identifies 10-25% energy savings through optimized operation, maintenance, and efficiency upgrades. Payback periods average 12-24 months for energy monitoring investments.

Efficiency Improvement Opportunities:

| Improvement Category | Energy Savings Potential | Investment Level | Payback Period | |---------------------|-------------------------|------------------|----------------| | Operating schedule optimization | 10-20% | Minimal | Immediate | | Proper maintenance (filters, alignment, lubrication) | 5-15% | Low | 3-12 months | | Control system optimization | 8-15% | Low-Medium | 6-18 months | | Variable speed drives | 20-50% for variable load | Medium | 12-30 months | | High-efficiency motors | 2-8% vs standard motors | Medium | 24-48 months | | Equipment right-sizing | 15-30% for oversized equipment | High | 36-60 months |

Compressed Air Optimization: Compressed air is one of the most expensive utilities, costing $0.20-0.40 per 1,000 cubic feet. Typical facilities waste 25-40% of compressed air production through leaks, inappropriate uses, and system inefficiency. Ultrasonic leak detection programs costing $5,000-20,000 identify leaks saving $20,000-100,000 annually in energy costs. Complete compressed air optimization programs deliver 20-35% energy reductions with 12-24 month paybacks.

Heat Recovery and Integration: Recovering waste heat from equipment for space heating, process heating, or power generation. Equipment like compressors, refrigeration systems, and process equipment reject significant heat that can offset heating costs. Heat recovery projects typically cost $25,000-250,000 with payback periods of 2-5 years depending on heating requirements and equipment operating hours.

Quality and Process Control

Equipment condition and operation directly impact product quality and process capability.

Statistical Process Control: Monitoring process outputs to detect when equipment performance shifts outside normal variation. SPC charts identify equipment degradation before it produces defects, enabling proactive maintenance. Organizations implementing SPC reduce quality-related downtime by 30-50% through early problem detection.

Process Capability Analysis: Measuring equipment capability to produce within specification limits. Process capability indices (Cp, Cpk) quantify the relationship between process variation and specification limits. Equipment with Cpk < 1.33 requires frequent monitoring and adjustment, while Cpk > 1.67 indicates capable processes requiring minimal intervention. Improving process capability from Cpk 1.0 to 1.5 reduces defect rates by 70-90%.

Precision Maintenance: Applying precision techniques during maintenance to minimize variability and extend equipment life. Precision alignment reduces bearing failures by 50-70% and extends seal life by 30-60%. Precision lubrication practices reduce lubricant consumption by 20-40% while extending equipment life by 30-50%. Precision maintenance requires additional training and tools ($10,000-30,000 per technician) but delivers 300-600% ROI through extended equipment life and improved reliability.

Equipment Qualification: Formal processes verifying that equipment can consistently produce products meeting specifications. Industries like pharmaceuticals and medical devices require Installation Qualification (IQ), Operational Qualification (OQ), and Performance Qualification (PQ). Even non-regulated industries benefit from qualification processes that document equipment capabilities and establish operating ranges for critical parameters.
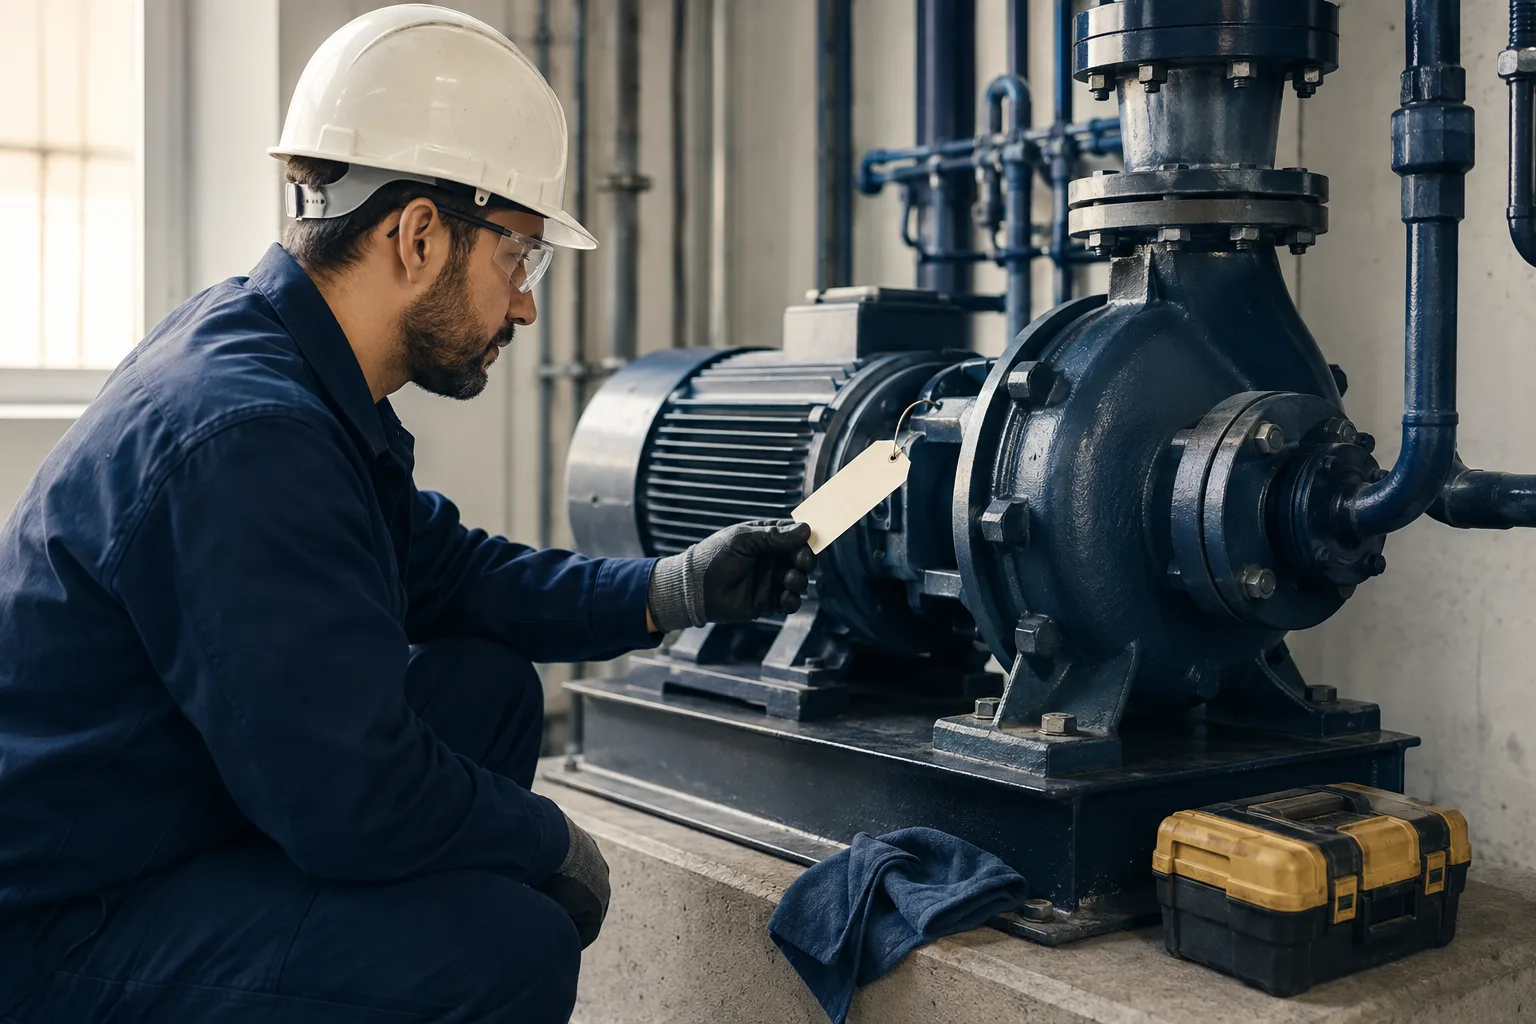
Compliance and Safety Management for Equipment

Equipment-related compliance and safety management prevents incidents, reduces liability, and ensures regulatory conformance.

Regulatory Compliance Requirements

Equipment operations face numerous regulatory requirements depending on industry, location, and equipment type.

OSHA Safety Requirements: Occupational Safety and Health Administration regulations cover machine guarding, lockout/tagout, confined space entry, personal protective equipment, and equipment-specific standards. OSHA citations average $15,000-25,000 per serious violation with willful violations reaching $150,000+. Organizations implementing comprehensive safety management systems reduce OSHA recordable incident rates by 40-60% compared to industry averages.

EPA Environmental Requirements: Environmental Protection Agency regulations address emissions, discharges, waste management, and chemical handling for equipment operations. Compliance monitoring prevents penalties averaging $37,500 per violation with maximums exceeding $500,000 for significant violations. Continuous emissions monitoring systems for regulated equipment cost $25,000-150,000 but prevent violation penalties and improve environmental performance.

Industry-Specific Regulations: Many industries face equipment-specific requirements:

  • Pressure Vessels/Boilers: ASME codes, state inspections, operator certification
  • Elevators: ASME A17.1, annual inspections, testing requirements
  • Food Equipment: FDA regulations, sanitary design, cleaning validation
  • Medical Equipment: FDA device regulations, calibration, preventive maintenance documentation
  • Transportation Equipment: DOT regulations, inspections, operator requirements

Inspection and Certification Management: Tracking and executing required equipment inspections prevents lapses causing compliance violations and operational shutdowns. Organizations missing required inspections face $10,000-100,000 penalties plus operational disruptions. Automated inspection tracking reduces missed inspections by 85-95% compared to manual systems.

Safety Program Integration

Equipment safety extends beyond compliance to creating intrinsically safe operations.

Lockout/Tagout (LOTO): Controlling hazardous energy during maintenance prevents 120 fatalities and 50,000 injuries annually in the US according to OSHA. Effective LOTO programs require equipment-specific procedures, employee training, periodic audits, and consistent enforcement. Organizations integrating LOTO procedures into work orders reduce energy control violations by 70-90% through systematic application.

Machine Guarding and Risk Assessment: Protecting workers from moving parts, flying debris, and contact hazards. Risk assessments should follow ANSI B11 standards or ISO 12100, systematically identifying hazards and implementing controls following the hierarchy of controls: elimination, substitution, engineering controls, administrative controls, PPE. Upgrading legacy equipment with modern guarding costs $5,000-50,000 per machine but prevents catastrophic injuries.

Confined Space Management: Managing equipment requiring entry into confined spaces like tanks, vessels, boilers, and pits. Confined space programs require space identification, hazard assessment, entry permits, monitoring equipment, rescue capabilities, and trained personnel. Confined space incidents have 60% fatality rates when procedures are not followed. Organizations implementing comprehensive confined space programs reduce incident risk by 90%+.

Equipment-Specific Safety Training: Ensuring operators and maintainers understand equipment hazards and safety protocols. Training effectiveness directly correlates with incident rates - well-trained workers experience 40-60% fewer equipment-related injuries. Training programs should include initial qualification, periodic refreshers, and competency assessment. Hands-on training reduces incidents more effectively than classroom-only approaches.

Personal Protective Equipment (PPE): Specifying and enforcing appropriate PPE for equipment operations and maintenance. While PPE is the last line of defense in the hierarchy of controls, proper PPE prevents 30-50% of injuries when engineering controls alone are insufficient. Equipment-specific PPE requirements should be documented in procedures and work orders, with compliance verification during safety audits.

Incident Investigation and Prevention

Learning from incidents prevents recurrence and identifies systemic improvement opportunities.

Root Cause Analysis: Investigating equipment-related incidents to identify underlying causes rather than blaming individuals. Effective root cause analysis uses structured methods like Five Whys, Fishbone Diagrams, or fault tree analysis to identify multiple contributing factors. Organizations implementing rigorous root cause analysis reduce repeat incidents by 60-80%.

Corrective and Preventive Actions (CAPA): Systematic processes ensuring incident findings lead to effective improvements. CAPA processes should identify root causes, develop corrective actions, implement changes, verify effectiveness, and communicate lessons learned. Organizations with formal CAPA systems resolve 85-95% of identified issues compared to 40-60% resolution without systematic processes.

Leading and Lagging Indicators: Tracking both outcome metrics (lagging indicators like injury rates, incidents, near-misses) and predictive metrics (leading indicators like safety observations, training completion, audit scores). Leading indicators enable proactive safety management while lagging indicators measure overall performance. World-class organizations achieve OSHA recordable incident rates below 0.5 per 100 workers (industry averages 2.5-3.5) through consistent focus on leading indicators.

Behavioral Safety Programs: Addressing human factors contributing to equipment incidents. Behavioral safety approaches focus on observation, feedback, and coaching rather than blame. Organizations implementing behavioral safety programs reduce incident rates by 40-70% over 2-3 years through cultural change and improved safety awareness.

EAM Software: Features, Vendors, and Selection

Selecting appropriate equipment asset management software determines organizational capabilities and improvement potential.

Essential EAM Software Capabilities

Comprehensive EAM solutions provide integrated functionality across the equipment lifecycle.

Asset Registry and Hierarchy: Centralized asset databases storing equipment information, specifications, relationships, and documentation. Leading systems support unlimited hierarchy levels, flexible attributes, parent-child relationships, and system groupings. Mobile barcode and RFID scanning enable rapid asset identification and data access. Organizations with complete asset registers achieve 20-30% faster maintenance response through better information access.

Work Order Management: Complete work order lifecycle including request management, planning, scheduling, execution, and closeout. Advanced capabilities include drag-and-drop scheduling, resource optimization, mobile work order access, parts reservation, and labor tracking. Organizations achieving 90%+ schedule compliance through effective work order management improve maintenance productivity by 25-40%.

Preventive Maintenance: Automated PM work order generation based on time, meter readings, or condition monitoring triggers. Capabilities should include flexible scheduling rules, PM task libraries, route optimization, and PM effectiveness tracking. Organizations with optimized PM programs achieve 95%+ PM compliance while maintaining preventive maintenance at 40-50% of total maintenance work.

Inventory and Procurement: Parts inventory management, purchasing, receiving, and vendor management. Capabilities should include min-max controls, automatic reordering, parts reservation, kitting, and inventory valuation. Leading systems connect parts to equipment bills of material, enabling faster parts identification. Integrated inventory management reduces parts stockouts by 40-60% while decreasing inventory carrying costs by 15-25%.

Condition Monitoring Integration: Connecting vibration analysis, thermography, oil analysis, and IoT monitoring systems to automatically generate work orders when thresholds are exceeded. Integration eliminates manual data transfer and ensures timely response to developing problems. Organizations integrating condition monitoring reduce the time from problem detection to maintenance action by 60-80%.

Analytics and Reporting: Standard reports, customizable dashboards, and analytics covering equipment performance, maintenance costs, reliability metrics, and compliance. Self-service analytics enable users to answer their own questions without IT support. Modern systems include AI-powered analytics predicting failures, optimizing schedules, and identifying improvement opportunities.

Mobile Capabilities: Smartphone and tablet applications enabling technicians to receive work orders, access procedures and documentation, capture data, record time and materials, and close work orders in the field. Mobile solutions improve data capture from 60-70% completeness to 90-95% while reducing technician administrative time by 30-50%.

EAM Software Deployment Models

Organizations can choose between cloud, on-premise, or hybrid deployment models.

Cloud/SaaS EAM: Software delivered as a service through internet browsers and mobile apps. Cloud solutions offer faster implementation (2-6 months vs 6-12 months for on-premise), lower upfront costs ($25,000-100,000 vs $150,000-500,000+), automatic updates, and scalability. Cloud pricing typically runs $50-200 per user monthly. Concerns include data security, customization limitations, and internet dependency.

On-Premise EAM: Software installed on organizational servers and managed by internal IT teams. On-premise solutions offer greater customization, integration control, and data sovereignty. However, they require larger upfront investments, longer implementation timelines, dedicated IT support, and periodic upgrade projects. Best for organizations with strict security requirements, extensive customization needs, or limited internet connectivity.

Hybrid Models: Combining cloud and on-premise components, such as cloud-based mobile apps connected to on-premise core systems. Hybrid approaches balance accessibility and control but increase complexity. Useful for organizations transitioning from on-premise to cloud or those with both connected and disconnected facilities.

Deployment Model Comparison:

| Factor | Cloud/SaaS | On-Premise | Hybrid | |--------|-----------|------------|--------| | Implementation Time | 2-6 months | 6-12 months | 4-9 months | | Upfront Cost | $25K-$100K | $150K-$500K+ | $75K-$300K | | Ongoing Cost | $600-$2,400 per user annually | 15-20% of license annually | Variable | | Customization | Limited to moderate | Extensive | Moderate | | Update Frequency | Continuous (quarterly) | Manual (18-36 months) | Mixed | | Mobile Access | Excellent | Requires VPN or gateway | Good | | Integration Complexity | API-based, moderate | Full control, extensive | Complex | | Best For | Small-medium orgs, fast deployment | Large orgs, high customization | Transition scenarios, mixed requirements |

Leading EAM Software Vendors

The EAM market includes enterprise vendors serving large organizations and specialized vendors targeting specific industries or company sizes.

Enterprise EAM Vendors:

IBM Maximo: Comprehensive EAM platform with deep functionality, extensive customization, strong asset management, and industry-specific solutions. Best for large industrial organizations ($500M+ revenue) with complex requirements. Typical investment: $250,000-$2M+. Strengths: Functionality breadth, scalability, industry solutions. Weaknesses: Complexity, implementation duration (9-18 months), cost.

Infor EAM: Robust EAM solution with strong preventive maintenance, work management, and supply chain integration. Available as CloudSuite or on-premise. Best for mid-size to large manufacturers and asset-intensive industries. Typical investment: $150,000-$750,000. Strengths: Industry experience, flexibility, cloud option. Weaknesses: User interface (legacy versions), upgrade complexity.

Oracle EAM: Integrated with Oracle E-Business Suite or available standalone. Strong financials integration, procurement, and asset lifecycle management. Best for large enterprises already using Oracle ecosystem. Typical investment: $200,000-$1M+. Strengths: Oracle integration, financial management, scalability. Weaknesses: Cost, complexity, Oracle dependency.

SAP EAM: Part of SAP S/4HANA or available through SAP Asset Management solutions. Deep integration with SAP business processes. Best for SAP-centric enterprises requiring integrated asset and business management. Typical investment: $300,000-$2M+. Strengths: SAP integration, real-time processing, analytics. Weaknesses: Cost, SAP requirement, complexity.

Mid-Market EAM Solutions:

Fiix (Rockwell Automation): Modern cloud CMMS with AI-powered capabilities, intuitive interface, and rapid implementation. Best for small to mid-size organizations (50-500 employees) seeking modern, user-friendly solutions. Typical investment: $15,000-$75,000. Strengths: User experience, implementation speed (4-8 weeks), mobile apps, AI features. Weaknesses: Limited customization, smaller vendor, enterprise scalability.

eMaint (Fluke Reliability): Cloud-based CMMS with strong preventive maintenance, user-friendly interface, and reasonable pricing. Best for small to mid-size facilities with straightforward requirements. Typical investment: $12,000-$60,000. Strengths: Ease of use, implementation speed, cost-effectiveness. Weaknesses: Limited advanced features, integration capabilities.

Maintenance Connection: Affordable CMMS with solid core functionality and flexible deployment options. Best for small organizations (10-100 employees) or single-facility operations. Typical investment: $5,000-$30,000. Strengths: Affordability, simplicity, customer support. Weaknesses: Limited advanced capabilities, scalability, mobile functionality.

UpKeep: Mobile-first CMMS designed for smartphones and tablets with desktop web access. Best for field service, facilities management, and maintenance teams requiring mobility. Typical investment: $8,000-$50,000. Strengths: Mobile experience, ease of use, quick implementation. Weaknesses: Desktop functionality, reporting, enterprise features.

EAM Vendor Comparison Matrix:

| Vendor | Deployment | Best For | Implementation Time | Total 5-Year Cost (100 users) | Key Strengths | |--------|------------|----------|-------------------|-------------------------------|---------------| | IBM Maximo | Cloud, On-premise | Large enterprises, complex needs | 9-18 months | $1M-$3M+ | Functionality depth, scalability | | Infor EAM | Cloud, On-premise | Mid-large manufacturers | 6-12 months | $600K-$1.5M | Industry solutions, flexibility | | Oracle EAM | Cloud, On-premise | Oracle-centric enterprises | 9-15 months | $900K-$2.5M | ERP integration, financials | | SAP EAM | Cloud, On-premise | SAP-centric enterprises | 9-18 months | $1.2M-$3M+ | SAP integration, real-time | | Fiix | Cloud | Small-mid size, modern approach | 1-3 months | $150K-$300K | User experience, AI capabilities | | eMaint | Cloud | Small-mid size facilities | 1-3 months | $125K-$250K | Ease of use, value | | Maintenance Connection | Cloud, On-premise | Small organizations | 1-2 months | $75K-$150K | Affordability, simplicity | | UpKeep | Cloud | Mobile-first operations | 2-6 weeks | $100K-$200K | Mobile experience, quick start |

EAM Software Selection Process

Systematic vendor selection ensures alignment between software capabilities and organizational requirements.

Requirements Definition: Documenting functional requirements, technical constraints, user needs, and integration requirements. Requirements gathering should involve 15-25 stakeholders across maintenance, operations, engineering, IT, and finance. Organizations developing comprehensive requirements (100-300 specific criteria) select vendors meeting 85-95% of needs compared to 60-75% for those with limited requirements definition.

Vendor Screening: Narrowing vendors from 10-15 options to 3-5 finalists based on deployment model, pricing, industry experience, and requirements alignment. Initial screening eliminates vendors lacking essential capabilities or exceeding budget constraints. RFI (Request for Information) processes provide standardized vendor information enabling efficient comparison.

Detailed Evaluation: Conducting vendor demonstrations, reference checks, prototype testing, and detailed scoring against requirements. Demonstrations should use organizational data and workflows rather than generic vendor demos. Reference checks should include similar-size organizations in similar industries, asking specific questions about implementation experience, ongoing support, and realized benefits.

Total Cost of Ownership Analysis: Evaluating complete five-year costs including software licenses, implementation services, hardware, training, ongoing support, and internal resources. TCO analysis reveals that software licenses typically represent 30-50% of total costs, with implementation (25-35%), ongoing support (15-20%), and internal resources (15-25%) comprising the balance. Organizations considering only license costs underestimate total investments by 50-100%.

Risk Assessment: Evaluating implementation risks, vendor stability, technology risks, and change management challenges. High-risk factors include first-time implementations, extensive customization requirements, limited vendor experience in the industry, and organizational change resistance. De-risking strategies include phased implementations, proof-of-concept projects, and additional change management resources.
Implementation Strategies for Equipment Asset Management

Successful EAM implementation requires systematic approaches addressing technology, processes, data, and organizational change.

Implementation Methodology

Phased implementation approaches deliver value incrementally while managing risk and complexity.

Phase 1: Foundation (Months 1-3): Establishing core capabilities including asset registry, work order management, and basic preventive maintenance. Foundation phase goals include 95%+ asset data accuracy, work order workflows operational, and core PM schedules active. Quick wins like mobile work orders or automated PM generation demonstrate value and build momentum.

Phase 2: Optimization (Months 4-9): Expanding functionality to include inventory management, advanced scheduling, condition monitoring integration, and analytics. Optimization phase focuses on efficiency improvements rather than new capabilities. Organizations completing optimization report 15-25% maintenance productivity improvements and 10-20% cost reductions.

Phase 3: Advanced Capabilities (Months 10-18): Implementing predictive maintenance, advanced analytics, reliability programs, and cross-functional integration. Advanced capabilities deliver incremental improvements of 8-12% beyond optimization phase results. Organizations reaching this maturity level achieve top-quartile maintenance performance.

Phase 4: Continuous Improvement (Months 19+): Refining processes, expanding coverage, pursuing targeted improvements, and leveraging emerging technologies. Continuous improvement sustains gains and adapts to changing requirements. Organizations maintaining improvement focus avoid the 30-50% performance degradation that occurs when systems are "implemented and forgotten."

Data Migration and Quality

Data quality determines EAM system value - poor data produces poor decisions regardless of software capabilities.

Asset Data Collection: Gathering complete, accurate equipment information is typically the most time-consuming implementation activity. Physical asset surveys identifying equipment, recording nameplate data, photographing assets, and assigning locations require 4-8 hours per 100 assets. Organizations should budget 200-500 hours for facilities with 5,000-10,000 assets. Barcode labeling adds 1-2 minutes per asset.

Data Cleansing and Validation: Reviewing and correcting legacy data before migration. Studies show that existing asset databases contain 30-50% errors including duplicate records, outdated information, disposed assets, and incomplete data. Data cleansing identifies and resolves discrepancies, standardizes naming conventions, and validates critical attributes. Organizations skipping cleansing spend 40-60% more time correcting data post-implementation.

Master Data Management: Establishing data governance processes ensuring ongoing data quality. Master data management defines data ownership, standardizes data entry, validates accuracy, and monitors quality metrics. Organizations maintaining 95%+ data accuracy achieve 3-4x better EAM value than those with 70-80% accuracy through better decision-making and less time spent data correction.

Data Quality Metrics: Tracking completeness (% required fields populated), accuracy (% data elements correct), consistency (% standardized entries), timeliness (% updated within specified intervals), and validity (% entries meeting business rules). Leading organizations achieve 95%+ scores across all quality dimensions through systematic data governance.

Change Management and User Adoption

Technology success depends on user adoption - systems with 60% adoption deliver 60% of potential value.

Stakeholder Engagement: Involving users throughout implementation builds ownership and ensures solution fit. Implementation teams should include 15-30% end users alongside IT and management representatives. User involvement in requirements definition, testing, and validation increases adoption by 30-50% compared to top-down implementations.

Training and Competency Development: Comprehensive training programs covering system navigation, business processes, data entry, and reporting. Training should include role-based instruction (operators need different content than planners), hands-on practice with realistic scenarios, and competency assessment. Organizations investing $500-1,500 per user in training achieve 80-95% proficiency compared to 50-70% for those spending $200-400 per user.

Communication and Expectations: Regular communication explaining implementation progress, upcoming changes, expected benefits, and support resources. Communication plans should include executive sponsorship messages, team updates, quick-win celebrations, and lessons learned sharing. Effective communication reduces resistance and accelerates adoption.

Support and Continuous Learning: Providing ongoing support through help desk services, super users, refresher training, and knowledge bases. Post-implementation support requirements typically equal 15-25% of implementation effort in the first year, declining to 5-10% in subsequent years. Organizations maintaining strong support achieve 85-95% sustained adoption compared to 60-75% for those providing minimal post-implementation support.

Adoption Measurement: Tracking system usage, data quality, process compliance, and user satisfaction. Leading indicators include login frequency, work orders created, PM compliance, and parts transactions. Organizations measuring adoption weekly in the first 6 months identify and address adoption barriers 40-60% faster than those measuring monthly or less frequently.

Integration Architecture

EAM systems should integrate with related enterprise systems to eliminate data silos and enable seamless workflows.

ERP Integration: Connecting EAM with enterprise resource planning systems for procurement, inventory, finance, and human resources. ERP integration eliminates duplicate data entry for purchase requisitions, receiving, invoicing, and financial transactions. Integration complexity varies from simple (pre-integrated EAM/ERP from same vendor) to extensive (different vendors requiring custom integration). Integration projects typically cost $50,000-$250,000 with 3-6 month timelines.

Condition Monitoring Integration: Connecting vibration systems, oil analysis labs, thermography software, and IoT platforms to automatically create work orders when problems are detected. Integration reduces detection-to-action time from 3-7 days to under 24 hours, preventing 20-40% more failures through faster response. Integration costs range from $15,000-$75,000 per monitoring system.

SCADA/Control System Integration: Connecting industrial control systems and SCADA to automatically capture equipment runtime, production counts, and operating parameters. Integration enables automated PM triggering based on actual usage rather than time, extending intervals by 20-40% while improving reliability. Integration complexity depends on control system protocols and data availability, ranging from straightforward (standard protocols like OPC) to complex (proprietary systems requiring custom development).

Business Intelligence Integration: Connecting EAM data to business intelligence platforms for advanced analytics, dashboards, and reporting. BI integration enables cross-functional analysis combining maintenance data with production, quality, and financial information. Organizations implementing BI integration identify 15-25% more improvement opportunities through better analytics capabilities.

ROI and Business Benefits of Equipment Asset Management

Comprehensive equipment asset management delivers measurable financial and operational benefits.

Financial Benefits and ROI Calculation

EAM investments deliver returns of 200-500% within 2-3 years through multiple benefit categories.

Maintenance Cost Reduction: Optimized maintenance strategies and improved efficiency reduce total maintenance spending by 15-30%. A facility with $2 million in annual maintenance costs achieves $300,000-600,000 in annual savings. Primary savings sources include reduced reactive maintenance (30-40%), optimized PM frequencies (15-25%), improved technician productivity (20-35%), and lower parts inventory (15-25%).

Downtime Reduction: Improved equipment reliability and faster response reduce unplanned downtime by 30-50%. For production operations where equipment downtime costs $5,000-50,000 per hour, downtime reduction generates $500,000-2M+ in annual value through increased production capacity. Industries with high downtime costs (continuous processing, automotive assembly, semiconductor manufacturing) achieve particularly strong benefits.

Extended Asset Life: Proper maintenance and operating practices extend equipment life by 20-40%, deferring capital replacement costs. For an organization with $50 million in equipment value on 15-year replacement cycles, extending life by 25% defers $2.5 million in annual capital requirements. Extended life benefits accumulate over time as replacement timing shifts out.

Energy Cost Savings: Optimized equipment operation and maintenance reduce energy consumption by 10-25%. For facilities spending $1-5 million annually on energy, savings of $100,000-1.25 million are achievable. Energy savings continue indefinitely while requiring minimal ongoing investment, providing compelling long-term value.

Inventory Optimization: Right-sizing parts inventory and improving parts availability reduce carrying costs by 20-35% while decreasing stockouts by 40-60%. A facility with $1 million in spare parts inventory saves $100,000-175,000 in annual carrying costs (inventory value x 15-25% carrying cost rate) while avoiding production losses from parts shortages.

Comprehensive ROI Example:

Manufacturing Facility Profile:

  • Equipment Value: $30 million
  • Annual Maintenance Budget: $1.5 million
  • Production Value: $75 million annually
  • Equipment Downtime Cost: $15,000 per hour
  • Current Downtime: 200 hours annually
  • Parts Inventory: $750,000
  • Annual Energy Cost: $2 million

EAM Implementation Investment:

  • Software (100 users, cloud): $125,000
  • Implementation Services: $200,000
  • Hardware/Mobile: $25,000
  • Training: $50,000
  • Internal Resources: $100,000
  • Total Investment: $500,000

Annual Benefits (Conservative Estimates):

  • Maintenance Cost Reduction (20%): $300,000
  • Downtime Reduction (35% - 70 hours): $1,050,000
  • Energy Savings (15%): $300,000
  • Inventory Optimization (25%): $93,750
  • Extended Asset Life (25%): $400,000 (deferred capital)
  • Total Annual Benefits: $2,143,750

ROI Calculation:

  • Net Annual Benefit: $2,143,750 - $100,000 (ongoing software) = $2,043,750
  • Payback Period: $500,000 / $2,043,750 = 2.9 months
  • 3-Year ROI: ($2,043,750 x 3 - $500,000) / $500,000 = 1,126%
  • Annual ROI: 409%

Operational Performance Improvements

Beyond financial benefits, EAM improves operational metrics that enhance competitiveness and customer satisfaction.

Equipment Availability: Increases from 85-90% to 95-98% through better maintenance strategies and faster response. Each percentage point of availability improvement creates 1% additional production capacity without capital investment. For a $75 million revenue facility, 5% availability improvement enables $3.75 million in additional revenue with minimal incremental cost.

Overall Equipment Effectiveness (OEE): Improves from 60-70% baseline to 75-85% through systematic loss elimination. OEE improvements combine availability gains, speed optimization, and quality improvements. Manufacturing operations typically achieve 10-20 OEE percentage point improvements over 24-36 months, generating 15-30% capacity increases.

Maintenance Productivity: Increases wrench time from 30-40% to 50-60% through better planning, scheduling, and mobile tools. Improved productivity enables the same technician workforce to complete 30-50% more work, creating capacity for proactive maintenance while reducing backlogs. Organizations should redirect productivity gains toward preventive and predictive work rather than reducing headcount.

First-Time Fix Rate: Improves from 65-75% to 85-95% through better diagnostics, parts availability, and procedures. Higher first-time fix rates reduce return visits, minimize equipment downtime, and improve customer satisfaction. Each percentage point improvement saves 2-3% of maintenance labor through eliminated callbacks.

Schedule Compliance: Increases from 60-75% to 85-95% through better coordination and planning. Schedule compliance improvements reduce wasted time from schedule changes, better coordinate maintenance with production, and enable more efficient resource utilization. Organizations achieving 90%+ schedule compliance report 20-35% better maintenance efficiency than those below 75%.

Strategic Business Benefits

Equipment asset management delivers strategic advantages beyond measurable financial returns.

Risk Reduction: Comprehensive EAM reduces safety incidents, environmental violations, regulatory penalties, and catastrophic failures. Risk reduction benefits are difficult to quantify but often exceed measurable financial benefits when major incidents are prevented. A single prevented serious injury saves $500,000-2M+ in direct costs plus incalculable human costs. Avoided environmental violations save $50,000-1M+ per incident in penalties, cleanup, and reputation damage.

Improved Decision Making: Accurate equipment data and performance metrics enable better capital planning, maintenance strategy optimization, and operational decisions. Organizations with mature EAM capabilities make decisions based on data rather than opinions or estimates, improving success rates by 30-50%. Better decisions compound over time, creating increasing competitive advantage.

Regulatory Compliance: Systematic compliance tracking prevents violations, simplifies audits, and demonstrates due diligence. Compliance benefits include avoided penalties ($10,000-1M+ per violation), reduced audit preparation time (60-80% reduction), improved audit results (30-50% fewer findings), and reduced liability exposure. Compliance benefits are particularly significant in highly regulated industries like utilities, pharmaceuticals, and aviation.

Organizational Knowledge Capture: EAM systems capture and preserve equipment knowledge that would otherwise exist only in individuals' experience. Knowledge capture prevents expertise loss when experienced workers retire, accelerates new employee development, and enables better problem-solving. Organizations experiencing high retirement rates in maintenance workforces achieve particularly strong knowledge capture benefits.

Sustainability and ESG: Equipment asset management supports environmental, social, and governance objectives through energy efficiency, emissions reduction, extended asset life, and improved safety. Sustainability benefits increasingly affect organizational reputation, investor relations, regulatory compliance, and competitive positioning. Public companies report EAM contributions to ESG metrics in sustainability reports and investor communications.

Industry-Specific Equipment Asset Management Best Practices

Different industries face unique equipment challenges requiring tailored EAM approaches.

Manufacturing Equipment Management

Manufacturing operations depend on equipment reliability for production output, quality, and delivery performance.

Production Equipment Criticality: Manufacturing EAM prioritizes equipment directly affecting production capacity, particularly bottleneck operations limiting overall throughput. Critical production equipment receives predictive monitoring, redundant backup, and optimized preventive maintenance. Non-critical equipment supporting bottleneck operations receives preventive strategies while truly non-critical equipment may operate on run-to-failure approaches.

OEE and TPM Integration: World-class manufacturers integrate Total Productive Maintenance (TPM) principles with EAM systems. TPM's eight pillars (autonomous maintenance, planned maintenance, quality maintenance, focused improvement, early equipment management, training, safety, and administrative efficiency) provide the framework while EAM systems provide the execution platform. Organizations combining TPM and EAM achieve 15-25% better results than those using either approach alone.

Changeover Management: Manufacturing equipment requiring frequent product changeovers benefits from SMED (Single-Minute Exchange of Die) integration with EAM. Recording changeover times, analyzing performance trends, and maintaining optimized changeover procedures reduces changeover duration by 40-75%. Reduced changeovers create capacity for additional production or enable smaller batch sizes improving flexibility.

Quality System Integration: Connecting EAM with quality management systems links equipment condition to product quality. When quality issues occur, integrated systems facilitate root cause analysis determining whether equipment problems contributed. Integration enables proactive maintenance when equipment shows quality impact before it produces defects. Manufacturing operations with EAM-QMS integration reduce quality-related downtime by 30-50%.

Construction and Heavy Equipment Management

Construction equipment management emphasizes utilization, mobility, and total ownership cost optimization.

Utilization Tracking and Optimization: Construction equipment represents massive capital investment with significant underutilization. GPS tracking and telematics reveal that 40-60% of owned equipment operates less than 40% of available time. Utilization tracking enables equipment sharing across projects, right-sizing the fleet, and identifying rental vs purchase opportunities. Organizations optimizing utilization reduce equipment fleets by 15-30% while maintaining or improving project support.

Mobile and Remote Management: Construction equipment operates across multiple dispersed sites requiring mobile and remote management capabilities. Cloud-based EAM with strong mobile capabilities enables project managers and technicians to request maintenance, track equipment location, record operating hours, and manage preventive maintenance without office access. Mobile capabilities reduce administrative time by 40-60% while improving data capture from 50-60% to 85-95%.

Operator-Based Maintenance: Construction equipment operates with dedicated operators who can perform daily inspections, basic maintenance, and early problem detection. Operator inspection apps guide daily checks and automatically create work orders when issues are found. Organizations implementing operator-based maintenance reduce unplanned failures by 25-40% through earlier problem detection.

Lifecycle Cost and Replace/Repair Decisions: Construction equipment faces continuous replace versus repair decisions based on age, condition, utilization, and maintenance costs. EAM systems tracking equipment history, maintenance costs, and downtime inform replacement timing decisions. Economic models comparing ownership costs with rental rates determine optimal replacement timing, typically when annual maintenance exceeds 15-20% of replacement cost or utilization drops below 30-40%.

Facilities and Building Equipment Management

Facility management encompasses diverse equipment types across HVAC, electrical, plumbing, elevators, and building automation systems.

Preventive Maintenance Compliance: Facility equipment faces stringent preventive maintenance requirements driven by manufacturer warranties, building codes, insurance requirements, and tenant expectations. Organizations managing 1M+ square feet typically schedule 2,000-5,000 PM tasks monthly. Automated PM scheduling and mobile execution ensure consistent compliance, preventing warranty voidance and reducing equipment failures by 35-50%.

Energy Management Integration: Facility equipment consumes 30-40% of total building operating costs through HVAC, lighting, and electrical systems. EAM integration with building automation systems and energy management platforms optimizes equipment operation for efficiency. Integration projects typically reduce facility energy costs by 15-25% with 18-30 month paybacks. Strategies include schedule optimization, demand response participation, and condition-based maintenance of energy-consuming equipment.

Tenant Service Integration: Commercial facilities require rapid response to tenant service requests affecting comfort and productivity. Service request portals integrated with EAM create work orders automatically, route to appropriate technicians, communicate status to requestors, and track satisfaction. Integrated service management improves average response time from 4-8 hours to under 2 hours while increasing first-time fix rates by 20-30%.

Multi-Site Standardization: Facility management organizations operating 10-100+ buildings benefit from standardized equipment, maintenance procedures, and parts inventory. Standardization enables technician flexibility across sites, reduces training requirements, optimizes inventory, and enables performance benchmarking. Organizations standardizing across facilities reduce maintenance costs by 12-20% per building while improving service consistency.

Fleet and Transportation Equipment Management

Fleet operations manage vehicles, trucks, trailers, and specialized mobile equipment emphasizing safety, compliance, and total cost of ownership.

Regulatory Compliance Management: Transportation equipment faces extensive Federal Motor Carrier Safety Administration (FMCSA) regulations including daily vehicle inspection reports (DVIR), annual inspections, driver qualifications, hours of service, and drug testing. EAM systems managing compliance requirements prevent violations averaging $15,000-50,000 per occurrence and protect operating authority. Automated compliance tracking reduces violations by 70-90% compared to manual processes.

Telematics Integration: Modern fleet management integrates telematics systems providing location, mileage, fuel consumption, diagnostic codes, driver behavior, and performance metrics. Telematics integration enables automated preventive maintenance triggering based on actual mileage/hours, fuel efficiency monitoring, driver coaching, and route optimization. Organizations implementing telematics integration reduce fuel costs by 10-20%, extend vehicle life by 15-25%, and improve driver safety by 25-40%.

Total Cost of Ownership Optimization: Fleet lifecycle management balances acquisition costs, fuel economy, maintenance expenses, downtime, and resale value. EAM systems tracking complete vehicle history inform replacement decisions, typically at 150,000-300,000 miles for commercial vehicles when maintenance costs exceed $0.25-0.40 per mile or reliability drops below acceptable thresholds. Organizations using data-driven replacement decisions achieve 15-25% lower total fleet costs than those using age-only criteria.

Driver-Involved Maintenance: Commercial drivers perform pre-trip and post-trip inspections, identify defects, and communicate maintenance needs. Electronic DVIR applications guide driver inspections, automatically create work orders for identified defects, and track defect resolution. Digital DVIR systems improve defect reporting by 40-60% while reducing compliance risks through complete documentation.

FAQ: Equipment Asset Management

What is equipment asset management?

Equipment asset management (EAM) is a comprehensive approach to managing physical equipment throughout its entire lifecycle, from acquisition through operation, maintenance, modification, and disposal. EAM optimizes equipment performance, minimizes lifecycle costs, ensures regulatory compliance, and maximizes return on investment through systematic processes, data-driven decisions, and integrated technology systems.

What is the difference between EAM and CMMS?

EAM (Equipment Asset Management) is a comprehensive strategy covering the entire equipment lifecycle including acquisition decisions, lifecycle cost management, performance optimization, and disposal planning. CMMS (Computerized Maintenance Management System) is the software system used to execute day-to-day maintenance operations including work orders, preventive maintenance, and parts inventory. EAM is the strategic approach while CMMS is the operational tool supporting execution.

How much does EAM software cost?

EAM software costs vary significantly based on vendor, deployment model, user count, and functionality. Cloud-based solutions typically cost $50-200 per user monthly ($600-2,400 annually per user). On-premise enterprise systems cost $150,000-$2M+ for initial licenses plus 15-20% annually for maintenance. Total five-year cost of ownership including implementation, hardware, training, and support typically runs $75,000-$3M+ depending on organization size and solution complexity.

What ROI can organizations expect from EAM implementation?

Organizations implementing comprehensive EAM systems typically achieve 200-500% ROI within 2-3 years. Payback periods average 6-18 months depending on baseline maturity and implementation scope. Benefits include 15-30% maintenance cost reductions, 30-50% downtime reductions, 10-25% energy savings, 20-35% inventory optimization, and 20-40% extended asset life. Medium-sized industrial operations typically realize $1-3 million in annual benefits from $300,000-800,000 investments.

How long does EAM implementation take?

Implementation timelines vary based on system complexity, organization size, and scope. Cloud-based CMMS implementations for small organizations complete in 2-6 months. Mid-market EAM implementations require 4-9 months for core capabilities and 12-18 months for complete deployment. Enterprise EAM systems at large complex organizations take 9-18 months for initial deployment and 18-36 months for full capability realization. Phased implementations deliver value incrementally rather than waiting for complete deployment.

What industries benefit most from EAM?

All equipment-intensive industries benefit from EAM, particularly manufacturing, utilities, transportation, construction, healthcare, facilities management, food and beverage, oil and gas, mining, and municipalities. Organizations with equipment values exceeding $10 million, maintenance budgets above $1 million annually, or where equipment reliability directly impacts revenue and safety achieve the strongest benefits. Companies with 100+ equipment assets requiring systematic maintenance should consider EAM implementation.

What are the key features of EAM software?

Essential EAM features include comprehensive asset registries, work order management, preventive maintenance scheduling, inventory and procurement, mobile capabilities, condition monitoring integration, analytics and reporting, compliance tracking, and integration with enterprise systems. Advanced capabilities include predictive maintenance analytics, IoT platform integration, GIS mapping, document management, and business intelligence. Organizations should prioritize core functionality before pursuing advanced features.

How does predictive maintenance integrate with EAM?

Predictive maintenance integrates with EAM through automated work order generation when condition monitoring systems detect developing problems. Vibration analysis, thermography, oil analysis, and IoT sensors connect to EAM systems through APIs or integration platforms. When monitored parameters exceed thresholds indicating potential failures, EAM systems automatically create work orders, assign resources, reserve parts, and schedule repairs. Integration reduces the time from problem detection to maintenance action by 60-80%.

What metrics should organizations track for equipment management?

Key equipment management metrics include Overall Equipment Effectiveness (OEE), equipment availability, Mean Time Between Failures (MTBF), Mean Time To Repair (MTTR), maintenance cost as percentage of replacement asset value, preventive maintenance compliance, schedule compliance, PM-to-total maintenance ratio, wrench time, parts availability, and energy consumption per unit produced. Organizations should track 8-12 core metrics aligned with strategic objectives rather than dozens of metrics that dilute focus.

How can organizations improve equipment reliability?

Equipment reliability improves through systematic approaches including optimized preventive maintenance programs, predictive condition monitoring, root cause failure analysis, precision maintenance practices, operator-involved maintenance, proper operating procedures, contamination control, and proactive design improvements. Organizations should focus on the 20-30% of equipment causing 70-80% of problems (Pareto principle) rather than spreading efforts across all assets. Reliability-centered maintenance (RCM) methodologies provide structured frameworks for reliability improvement.

What is equipment lifecycle management?

Equipment lifecycle management encompasses all activities and decisions from initial need identification through equipment specification, acquisition, installation, operation, maintenance, modification, and eventual disposal. Lifecycle management focuses on total cost of ownership rather than initial purchase price, recognizing that purchase costs typically represent only 20-30% of total lifecycle costs. Effective lifecycle management extends asset life by 20-40% while reducing total ownership costs by 15-30%. For detailed lifecycle information, see our Asset Lifecycle Management guide.

How should organizations select EAM software?

EAM selection should follow a systematic process: (1) Define requirements involving 15-25 stakeholders across maintenance, operations, IT, and finance, (2) Screen vendors based on deployment model, industry experience, and price range, (3) Conduct detailed demonstrations using organizational data and workflows, (4) Check references from similar organizations, (5) Calculate total cost of ownership over 5 years, (6) Assess implementation risks and vendor stability. Organizations should prioritize requirements alignment and implementation support over feature breadth.

What is the difference between preventive and predictive maintenance?

Preventive maintenance performs scheduled tasks at predetermined intervals (time or usage-based) to prevent failures, such as lubrication every 30 days or filter changes every 500 hours. Predictive maintenance uses condition monitoring technologies to identify developing problems and optimize maintenance timing based on actual equipment condition rather than fixed schedules. Predictive approaches typically reduce maintenance costs by 8-12% compared to preventive while improving reliability, but require monitoring technology investments. Most organizations use both approaches for different equipment types.

How does mobile technology improve equipment management?

Mobile technology enables maintenance technicians to receive work orders, access procedures and documentation, record labor and materials, capture photos and notes, and close work orders using smartphones and tablets without returning to offices. Mobile solutions improve technician efficiency by 10-20% through reduced administrative time, improve data capture from 60-70% to 90-95% completeness, and accelerate work order closure from 3-5 days to same-day. Mobile implementations typically achieve payback in 6-12 months through efficiency improvements.

What role does IoT play in equipment management?

Internet of Things (IoT) technologies enable real-time equipment monitoring through sensors measuring temperature, pressure, vibration, current, and other parameters. IoT data supports predictive maintenance by identifying developing problems 30-90 days before failures, optimizes preventive maintenance through condition-based triggering, and improves performance through continuous monitoring. Organizations implementing IoT monitoring reduce unplanned downtime by 30-50% and extend maintenance intervals by 20-40% through condition-based strategies. IoT investments typically achieve 200-400% ROI through avoided failures and optimized maintenance.


Related Resources

For more information on related topics, see these comprehensive guides:


Conclusion

Equipment asset management represents a comprehensive approach to maximizing value from physical equipment assets throughout their operational lifecycle. Organizations implementing systematic EAM achieve 15-30% maintenance cost reductions, 30-50% downtime improvements, and 20-40% extended asset life through optimized strategies, integrated technologies, and data-driven decision-making.

Successful equipment asset management requires integration across multiple dimensions:

Strategic Alignment: Connecting equipment decisions and investments to organizational objectives, ensuring assets support rather than constrain business success.

Lifecycle Perspective: Optimizing total cost of ownership from acquisition through disposal rather than focusing narrowly on purchase costs or operating expenses in isolation.

Integrated Technology: Leveraging EAM software, condition monitoring, IoT sensors, and analytics platforms that work together seamlessly rather than operating as disconnected point solutions.

Proactive Maintenance: Shifting from reactive firefighting toward preventive and predictive approaches that prevent failures rather than responding after they occur.

Continuous Improvement: Sustaining gains through ongoing measurement, analysis, and refinement rather than implementing systems that stagnate after initial deployment.

Organizations beginning their EAM journey should start with foundation capabilities including accurate asset registries, disciplined work management, and optimized preventive maintenance before pursuing advanced technologies like predictive analytics and IoT monitoring. This staged approach delivers incremental value while building capabilities required for advanced maturity.

The investment in comprehensive equipment asset management delivers compelling returns - typically 200-500% ROI within 2-3 years - while positioning organizations for long-term competitive advantage through superior equipment reliability, efficiency, and lifecycle value optimization.


Schema Markup:

{
  "@context": "https://schema.org",
  "@type": "Article",
  "headline": "Equipment Asset Management: Complete Guide for 2025",
  "description": "Comprehensive guide to equipment asset management covering lifecycle optimization, EAM software selection, implementation strategies, and ROI maximization.",
  "author": {
    "@type": "Organization",
    "name": "SMMS Content Team"
  },
  "publisher": {
    "@type": "Organization",
    "name": "SMMS",
    "logo": {
      "@type": "ImageObject",
      "url": "https://example.com/logo.png"
    }
  },
  "datePublished": "2025-10-15",
  "dateModified": "2025-10-15",
  "mainEntityOfPage": {
    "@type": "WebPage",
    "@id": "https://example.com/equipment-asset-management"
  },
  "image": "https://example.com/images/equipment-asset-management.jpg",
  "articleSection": "Asset Management",
  "keywords": ["equipment asset management", "EAM software", "equipment lifecycle management", "equipment maintenance management", "asset tracking", "preventive maintenance", "predictive maintenance"]
}
{
  "@context": "https://schema.org",
  "@type": "FAQPage",
  "mainEntity": [
    {
      "@type": "Question",
      "name": "What is equipment asset management?",
      "acceptedAnswer": {
        "@type": "Answer",
        "text": "Equipment asset management (EAM) is a comprehensive approach to managing physical equipment throughout its entire lifecycle, from acquisition through operation, maintenance, modification, and disposal. EAM optimizes equipment performance, minimizes lifecycle costs, ensures regulatory compliance, and maximizes return on investment through systematic processes, data-driven decisions, and integrated technology systems."
      }
    },
    {
      "@type": "Question",
      "name": "What is the difference between EAM and CMMS?",
      "acceptedAnswer": {
        "@type": "Answer",
        "text": "EAM (Equipment Asset Management) is a comprehensive strategy covering the entire equipment lifecycle including acquisition decisions, lifecycle cost management, performance optimization, and disposal planning. CMMS (Computerized Maintenance Management System) is the software system used to execute day-to-day maintenance operations including work orders, preventive maintenance, and parts inventory. EAM is the strategic approach while CMMS is the operational tool supporting execution."
      }
    },
    {
      "@type": "Question",
      "name": "How much does EAM software cost?",
      "acceptedAnswer": {
        "@type": "Answer",
        "text": "EAM software costs vary significantly based on vendor, deployment model, user count, and functionality. Cloud-based solutions typically cost $50-200 per user monthly ($600-2,400 annually per user). On-premise enterprise systems cost $150,000-$2M+ for initial licenses plus 15-20% annually for maintenance. Total five-year cost of ownership including implementation, hardware, training, and support typically runs $75,000-$3M+ depending on organization size and solution complexity."
      }
    },
    {
      "@type": "Question",
      "name": "What ROI can organizations expect from EAM implementation?",
      "acceptedAnswer": {
        "@type": "Answer",
        "text": "Organizations implementing comprehensive EAM systems typically achieve 200-500% ROI within 2-3 years. Payback periods average 6-18 months depending on baseline maturity and implementation scope. Benefits include 15-30% maintenance cost reductions, 30-50% downtime reductions, 10-25% energy savings, 20-35% inventory optimization, and 20-40% extended asset life. Medium-sized industrial operations typically realize $1-3 million in annual benefits from $300,000-800,000 investments."
      }
    },
    {
      "@type": "Question",
      "name": "How long does EAM implementation take?",
      "acceptedAnswer": {
        "@type": "Answer",
        "text": "Implementation timelines vary based on system complexity, organization size, and scope. Cloud-based CMMS implementations for small organizations complete in 2-6 months. Mid-market EAM implementations require 4-9 months for core capabilities and 12-18 months for complete deployment. Enterprise EAM systems at large complex organizations take 9-18 months for initial deployment and 18-36 months for full capability realization. Phased implementations deliver value incrementally rather than waiting for complete deployment."
      }
    },
    {
      "@type": "Question",
      "name": "What are the key features of EAM software?",
      "acceptedAnswer": {
        "@type": "Answer",
        "text": "Essential EAM features include comprehensive asset registries, work order management, preventive maintenance scheduling, inventory and procurement, mobile capabilities, condition monitoring integration, analytics and reporting, compliance tracking, and integration with enterprise systems. Advanced capabilities include predictive maintenance analytics, IoT platform integration, GIS mapping, document management, and business intelligence."
      }
    },
    {
      "@type": "Question",
      "name": "How does predictive maintenance integrate with EAM?",
      "acceptedAnswer": {
        "@type": "Answer",
        "text": "Predictive maintenance integrates with EAM through automated work order generation when condition monitoring systems detect developing problems. Vibration analysis, thermography, oil analysis, and IoT sensors connect to EAM systems through APIs or integration platforms. When monitored parameters exceed thresholds indicating potential failures, EAM systems automatically create work orders, assign resources, reserve parts, and schedule repairs. Integration reduces the time from problem detection to maintenance action by 60-80%."
      }
    },
    {
      "@type": "Question",
      "name": "What metrics should organizations track for equipment management?",
      "acceptedAnswer": {
        "@type": "Answer",
        "text": "Key equipment management metrics include Overall Equipment Effectiveness (OEE), equipment availability, Mean Time Between Failures (MTBF), Mean Time To Repair (MTTR), maintenance cost as percentage of replacement asset value, preventive maintenance compliance, schedule compliance, PM-to-total maintenance ratio, wrench time, parts availability, and energy consumption per unit produced. Organizations should track 8-12 core metrics aligned with strategic objectives."
      }
    },
    {
      "@type": "Question",
      "name": "How can organizations improve equipment reliability?",
      "acceptedAnswer": {
        "@type": "Answer",
        "text": "Equipment reliability improves through systematic approaches including optimized preventive maintenance programs, predictive condition monitoring, root cause failure analysis, precision maintenance practices, operator-involved maintenance, proper operating procedures, contamination control, and proactive design improvements. Organizations should focus on the 20-30% of equipment causing 70-80% of problems rather than spreading efforts across all assets."
      }
    },
    {
      "@type": "Question",
      "name": "What is equipment lifecycle management?",
      "acceptedAnswer": {
        "@type": "Answer",
        "text": "Equipment lifecycle management encompasses all activities and decisions from initial need identification through equipment specification, acquisition, installation, operation, maintenance, modification, and eventual disposal. Lifecycle management focuses on total cost of ownership rather than initial purchase price, recognizing that purchase costs typically represent only 20-30% of total lifecycle costs. Effective lifecycle management extends asset life by 20-40% while reducing total ownership costs by 15-30%."
      }
    },
    {
      "@type": "Question",
      "name": "How should organizations select EAM software?",
      "acceptedAnswer": {
        "@type": "Answer",
        "text": "EAM selection should follow a systematic process: (1) Define requirements involving 15-25 stakeholders, (2) Screen vendors based on deployment model, industry experience, and price range, (3) Conduct detailed demonstrations using organizational data and workflows, (4) Check references from similar organizations, (5) Calculate total cost of ownership over 5 years, (6) Assess implementation risks and vendor stability. Organizations should prioritize requirements alignment and implementation support over feature breadth."
      }
    },
    {
      "@type": "Question",
      "name": "What is the difference between preventive and predictive maintenance?",
      "acceptedAnswer": {
        "@type": "Answer",
        "text": "Preventive maintenance performs scheduled tasks at predetermined intervals (time or usage-based) to prevent failures. Predictive maintenance uses condition monitoring technologies to identify developing problems and optimize maintenance timing based on actual equipment condition rather than fixed schedules. Predictive approaches typically reduce maintenance costs by 8-12% compared to preventive while improving reliability, but require monitoring technology investments."
      }
    },
    {
      "@type": "Question",
      "name": "How does mobile technology improve equipment management?",
      "acceptedAnswer": {
        "@type": "Answer",
        "text": "Mobile technology enables maintenance technicians to receive work orders, access procedures and documentation, record labor and materials, capture photos and notes, and close work orders using smartphones and tablets. Mobile solutions improve technician efficiency by 10-20% through reduced administrative time, improve data capture from 60-70% to 90-95% completeness, and accelerate work order closure from 3-5 days to same-day. Mobile implementations typically achieve payback in 6-12 months."
      }
    },
    {
      "@type": "Question",
      "name": "What role does IoT play in equipment management?",
      "acceptedAnswer": {
        "@type": "Answer",
        "text": "Internet of Things (IoT) technologies enable real-time equipment monitoring through sensors measuring temperature, pressure, vibration, current, and other parameters. IoT data supports predictive maintenance by identifying developing problems 30-90 days before failures, optimizes preventive maintenance through condition-based triggering, and improves performance through continuous monitoring. Organizations implementing IoT monitoring reduce unplanned downtime by 30-50% and extend maintenance intervals by 20-40%."
      }
    },
    {
      "@type": "Question",
      "name": "What industries benefit most from EAM?",
      "acceptedAnswer": {
        "@type": "Answer",
        "text": "All equipment-intensive industries benefit from EAM, particularly manufacturing, utilities, transportation, construction, healthcare, facilities management, food and beverage, oil and gas, mining, and municipalities. Organizations with equipment values exceeding $10 million, maintenance budgets above $1 million annually, or where equipment reliability directly impacts revenue and safety achieve the strongest benefits."
      }
    }
  ]
}
{
  "@context": "https://schema.org",
  "@type": "HowTo",
  "name": "How to Implement Equipment Asset Management",
  "description": "Step-by-step guide to implementing a comprehensive equipment asset management system",
  "totalTime": "P12M",
  "step": [
    {
      "@type": "HowToStep",
      "name": "Phase 1: Foundation",
      "text": "Establish core capabilities including asset registry, work order management, and basic preventive maintenance. Goals include 95%+ asset data accuracy, operational work order workflows, and active PM schedules.",
      "position": 1
    },
    {
      "@type": "HowToStep",
      "name": "Phase 2: Optimization",
      "text": "Expand functionality to include inventory management, advanced scheduling, condition monitoring integration, and analytics. Focus on efficiency improvements and expect 15-25% maintenance productivity gains.",
      "position": 2
    },
    {
      "@type": "HowToStep",
      "name": "Phase 3: Advanced Capabilities",
      "text": "Implement predictive maintenance, advanced analytics, reliability programs, and cross-functional integration. Deliver incremental improvements of 8-12% beyond optimization phase results.",
      "position": 3
    },
    {
      "@type": "HowToStep",
      "name": "Phase 4: Continuous Improvement",
      "text": "Refine processes, expand coverage, pursue targeted improvements, and leverage emerging technologies. Sustain gains and adapt to changing requirements through ongoing measurement and refinement.",
      "position": 4
    }
  ]
}