A manufacturing predictive-maintenance pilot should begin with a defined equipment concern and a production decision. The team needs interpretable condition evidence, operating context and an owned response. Connecting a machine is an intermediate step; the useful result is a decision the operating team can explain and act on.
Predictive Maintenance in Manufacturing
In manufacturing, condition monitoring needs to be evaluated in the context of production output, quality and the specific equipment failure mode.
Manufacturing Applications and Equipment Coverage
Predictive maintenance technologies monitor critical manufacturing equipment across all production stages:
Production machinery: CNC machines, stamping presses, injection molding machines, assembly equipment, and processing machinery benefit from vibration monitoring, temperature sensing, and motor current analysis that detect bearing problems, tool wear, and mechanical degradation.
Material handling systems: Conveyors, automated guided vehicles (AGVs), cranes, and robotic systems require monitoring to prevent failures that halt entire production lines. Predictive maintenance monitors motor health, bearing condition, belt tension, and chain wear.
HVAC and compressed air systems: While not directly producing products, these support systems critically impact operations. Compressed air system leaks waste energy and reduce pressure; HVAC failures affect product quality in controlled environments.
Hydraulic and pneumatic systems: Power transmission systems throughout factories benefit from pressure monitoring, oil analysis, and leak detection that prevent failures affecting multiple machines.
Equipment Performance Monitoring
Beyond failure prevention, predictive maintenance in manufacturing environments monitors equipment performance:
Overall Equipment Effectiveness (OEE) tracking integrates predictive maintenance data with production metrics, correlating equipment health with availability, performance, and quality rates. A change in OEE can have equipment, production, quality or data-definition causes; investigate the underlying factors before attributing it to degradation.
Process parameter monitoring detects drifts in critical parameters—temperature profiles, pressure curves, cycle times—that indicate equipment degradation affecting product quality or efficiency.
Tool wear monitoring predicts when cutting tools, dies, or other consumables need replacement, optimizing tool life while preventing quality defects or equipment damage from excessive wear.
Production Optimization Through Predictive Insights
Predictive maintenance data enables production optimization:
Dynamic scheduling adjusts production schedules based on equipment health, avoiding assigning complex or high-speed jobs to equipment showing early degradation signs.
Predictive quality management correlates equipment condition with product quality metrics, identifying when equipment health impacts quality even before failures occur.
Energy optimization uses equipment health data to optimize energy consumption, as degrading equipment typically consumes more power while delivering reduced performance.
Industry 4.0 Integration
Predictive maintenance forms a cornerstone of Industry 4.0 smart manufacturing initiatives:
Digital thread integration connects predictive maintenance data throughout the product lifecycle, from design through manufacturing and field service, creating closed loops that improve future designs based on in-service experience.
Smart manufacturing execution integrates equipment health into manufacturing execution systems (MES), supporting separately reviewed decisions about production and maintenance.
Cyber-physical systems combine physical equipment monitoring with digital twins and simulation, enabling what-if analysis and optimization that balances production, quality, maintenance, and cost objectives.
These manufacturing implementations demonstrate that predictive maintenance delivers value not just through prevented failures but through enhanced operational performance across availability, quality, and cost dimensions.

AI-generated editorial illustration; not a customer photograph or product screenshot.
Monitoring and Reliability Programs for Critical Assets
Comprehensive monitoring programs provide real-time visibility into critical asset health, enabling early intervention and optimized maintenance timing.
Continuous Condition Monitoring Systems
Permanently installed monitoring systems provide 24/7 surveillance of mission-critical equipment:
Vibration Monitoring Systems: Permanently mounted accelerometers with centralized data acquisition systems monitor critical rotating equipment continuously. These systems detect developing faults within hours rather than weeks between periodic route-based measurements.
Continuous vibration monitoring provides:
- Real-time alerts for sudden changes (bearing failures, rotor rubs)
- Trending analysis detecting slow degradation
- Automated fault diagnosis using AI/machine learning
- Remote monitoring capability
- Historical database for reliability analysis
Process Parameter Monitoring: SCADA and DCS systems track temperatures, pressures, flows, and performance indicators providing operational health visibility. Advanced systems employ statistical process control detecting anomalies before alarm thresholds.
Oil Condition Monitoring: Online sensors measure oil particle counts, moisture content, viscosity, and acidity providing real-time lubricant health status. These systems alert to contamination events enabling immediate corrective action.
Motor Current Monitoring: Continuously analyzes motor electrical signatures detecting rotor bar failures, stator issues, load anomalies, and driven equipment problems without physical access to equipment.
System Integration: Leading implementations integrate multiple monitoring technologies into unified platforms providing holistic asset health views and automated diagnostic capabilities.
Key Performance Indicators for Critical Assets
Effective asset performance management requires tracking specific metrics:
Reliability Metrics:
MTTR reduction strategies include:
- Pre-staged spare parts
- Detailed repair procedures
- Trained technician availability
- Specialized tools and equipment ready
- Vendor support contracts
Failure Rate: Number of failures per operating hour or year. Critical assets should demonstrate declining failure rates over time as reliability improvements take effect.
Availability Metrics:
OEE = Availability × Performance Rate × Quality Rate
Condition Metrics:
Health Score/Condition Index: Composite scores combining multiple condition indicators into single asset health rating (typically 0-100 scale). Declining health scores trigger proactive intervention.
Alarm/Alert Frequency: Tracking condition monitoring alerts over time. Increasing alert frequency indicates deteriorating health requiring investigation.
Maintenance Cost Metrics:
Maintenance Cost per Operating Hour: Total maintenance costs divided by operating hours. Critical assets often show higher cost per hour but lower total cost of ownership through prevented failures.
Cost of Downtime Avoided: Estimated revenue/production preserved through proactive maintenance preventing unplanned outages. This metric demonstrates maintenance program value.
Spare Parts Inventory Turn: For critical asset spares. While standard parts target high turnover, critical spares intentionally maintain strategic stock justifying lower turn rates.
Reliability Improvement Programs
Structured programs systematically enhance critical asset reliability:
Root Cause Failure Analysis (RCFA): Mandatory investigation of all critical asset failures identifying underlying causes and implementing permanent corrective actions.
RCFA methodologies include:
- 5-Why analysis
- Fishbone (Ishikawa) diagrams
- Fault tree analysis
- Failure mode analysis
Bad Actor Programs: Focused improvement initiatives targeting chronic problem equipment. Assets appearing on bad actor lists (typically top 10-20 worst performers) receive intensive analysis and improvement efforts.
Bad actor identification criteria:
- Highest maintenance cost assets
- Most frequent failure assets
- Longest downtime contributors
- Chronic repeat failure equipment
Continuous Improvement Cycles: Applying Plan-Do-Check-Act (PDCA) methodology to systematically enhance critical asset performance through iterative improvements.
Failure Pattern Analysis: Statistical analysis identifying failure distributions, enabling appropriate maintenance strategies:
- Bathtub curve analysis
- Weibull analysis
- Reliability block diagrams
- Markov modeling for complex systems
Asset Health Scoring and Dashboards
Visual management systems provide real-time critical asset status visibility:
Health Scoring Methodologies:
Composite health scores combine multiple inputs:
- Condition monitoring readings (vibration, temperature, oil analysis)
- Operational parameters (efficiency, capacity, energy consumption)
- Maintenance history (failure frequency, repair costs)
- Age and lifecycle stage
- Pending maintenance or inspections
Health Score = (Condition × 0.40) + (Performance × 0.30) + (Maintenance × 0.20) + (Age × 0.10)
Scores typically range 0-100 with classifications:
- 85-100: Excellent (green)
- 70-84: Good (yellow)
- 50-69: Fair (orange)
- <50: Poor (red)
Dashboard Design:
Effective critical asset dashboards include:
- Overall fleet health summary (percentage in each health category)
- Individual asset health scores with trend arrows
- Active alerts and exceptions requiring attention
- Upcoming maintenance schedule
- Performance against reliability KPIs
- Downtime impact (actual vs. target)
- Cost metrics (maintenance spending, downtime costs avoided)
Risk Heat Maps: Visual representations plotting assets by failure probability and consequence, clearly identifying highest-risk equipment requiring immediate attention.
Mobile Accessibility: Modern platforms provide smartphone/tablet access enabling field technicians and managers to check asset status remotely.
AI-generated editorial illustration; not a customer photograph or product screenshot.
Predictive and Prescriptive Maintenance in APM
Asset performance management transforms maintenance from reactive and time-based approaches to predictive and prescriptive strategies that optimize intervention timing and actions. These advanced maintenance strategies deliver substantial improvements in equipment reliability, availability, and maintenance cost efficiency.
Predictive Maintenance Fundamentals
Predictive maintenance (PdM) uses condition monitoring data and analytical models to estimate developing condition or failure risk within a defined application, enabling maintenance to be scheduled just before failure. This approach avoids premature component replacement (typical with time-based preventive maintenance) while preventing unplanned downtime (typical with reactive maintenance).
Effective predictive maintenance programs require three key elements. First, continuous or periodic condition monitoring captures data about asset health through sensors, inspections, or tests. Second, baseline data establishes normal operating patterns and acceptable condition parameters. Third, analytical models detect deviations from normal behavior and predict time-to-failure based on degradation rates.
Remaining Useful Life Prediction
Remaining useful life (RUL) prediction estimates how long equipment will continue operating before failure or performance degradation requires intervention. Accurate RUL predictions enable optimal maintenance scheduling that maximizes equipment utilization while minimizing failure risk.
Physics-based RUL prediction simulates equipment degradation using engineering models of wear, fatigue, corrosion, or other failure mechanisms. These models incorporate material properties, loading conditions, environmental factors, and design parameters to predict failure progression. Crack growth models estimate remaining life for structural components subject to fatigue. Wear models predict bearing life based on load, speed, and lubrication conditions.
Failure Mode Prediction and Classification
Multi-class classification models distinguish between different failure types based on condition monitoring signatures. Vibration patterns differentiate between bearing inner race defects, outer race defects, ball defects, and cage damage. Each defect type produces characteristic frequencies that algorithms learn to recognize. Thermal signatures distinguish between electrical connection problems, overload conditions, and cooling system failures.
Feature engineering extracts diagnostic indicators from raw sensor data that correlate with specific failure modes. Time-domain features including RMS, peak, kurtosis, and crest factor capture different aspects of vibration signals. Frequency-domain features including spectral peak amplitudes, frequency band energies, and spectral entropy reveal fault-characteristic frequencies. Deep learning approaches automatically learn relevant features through convolutional neural networks that process raw signals.
Prescriptive Maintenance Decision-Making
Prescriptive maintenance extends beyond failure prediction to recommend specific actions that optimize maintenance effectiveness and business outcomes. These systems consider multiple factors including failure probability, failure consequences, maintenance costs, resource availability, and operational constraints to prescribe optimal interventions.
Decision optimization algorithms evaluate alternative maintenance actions and timing options to maximize equipment availability while minimizing lifecycle costs. These models compare options including immediate repair, scheduled maintenance during next planned outage, continued operation with increased monitoring, and run-to-failure with contingency plans. The optimal decision balances failure risk against maintenance costs and production impact.
Context-aware recommendations incorporate operational constraints including production schedules, spare parts availability, maintenance resource capacity, and shutdown coordination requirements. Systems automatically check parts inventory and trigger purchase orders when required components are unavailable. They schedule work during planned production outages or low-demand periods to minimize business impact.
Condition-Based Maintenance Strategies
Condition-based maintenance (CBM) triggers maintenance actions when condition indicators exceed predetermined thresholds or degradation rates reach critical levels. This strategy ensures maintenance occurs only when needed based on actual equipment condition rather than elapsed time or usage.
Multi-parameter CBM strategies combine multiple condition indicators using health indices that aggregate various measurements into composite scores. Equipment health scores ranging from 0-100 integrate vibration levels, temperature measurements, oil analysis results, and performance parameters using weighted algorithms. Scores below 60 trigger maintenance planning, below 40 require immediate inspection, and below 20 mandate urgent intervention.
Maintenance Planning and Scheduling Optimization
APM systems optimize maintenance planning and scheduling by coordinating activities across multiple assets and maintenance teams. These systems generate maintenance plans that minimize total cost including direct maintenance expenses, production losses, and failure risk costs.
Multi-asset optimization schedules maintenance across equipment fleets to balance workload, share resources, and consolidate downtime. For production lines with multiple machines, coordinated maintenance during single shutdown periods reduces total downtime compared to individual equipment maintenance. For geographically distributed assets, route optimization minimizes travel time for field technicians.
Resource capacity planning ensures maintenance plans are executable given available technicians, tools, and materials. Systems check skill requirements against qualified personnel availability and adjust schedules to prevent overloading resources. They identify capacity constraints that require additional resources or adjusted priorities.
Spare parts optimization balances inventory costs against stockout risks. Predictive maintenance forecasts generate parts demand projections that guide inventory replenishment decisions. Critical spare parts for high-consequence failures maintain adequate stock levels. Commodity parts use just-in-time procurement to minimize inventory carrying costs.

AI-generated editorial illustration; not a customer photograph or product screenshot.
Select a pilot around a production decision
Choose a defined production asset and a failure mode for which a useful condition signal may exist. Identify the production consequence, the maintenance decision and the time needed to prepare an intervention. A project that starts by connecting every machine can accumulate data before the team has agreed how any observation changes work.
Include production and quality representatives alongside maintenance and the relevant equipment specialist. A machine may behave differently across products, speeds or operating states. Those differences need context before an analyst can interpret an apparent change as degradation. Retain the operating condition with the observation rather than asking the analyst to reconstruct it later.
Write the pilot's limits explicitly. It may test a measurement and a manual review process without testing a predictive model. It may cover one failure mode without covering every way the machine can stop. This keeps the result useful and prevents a successful narrow trial from becoming an unsupported claim of complete machine coverage.

AI-generated editorial illustration; not a customer photograph or product screenshot.
Plan the response around the production constraint
An early finding creates an opportunity only if someone can evaluate and act on it. The planner needs a route to diagnostic support, parts, qualified labour and an approved work window. Ask what happens when the next available window is later than the reviewer considers acceptable. Escalation must reach the responsible operational and technical decision-makers.
Distinguish the condition finding from the production scheduling decision. The analyst supplies evidence and limitations; the authorized team decides the appropriate response within the site's procedures. A general dashboard should not autonomously change production routing or authorize continued operation unless that separate control scope has been engineered and approved.
Record the actual response. If work was delayed by a part, preserve that constraint rather than attributing the whole delay to the monitoring method. If the finding required further diagnosis, retain the diagnostic result. These details explain whether the project needs a better signal, a better review process or better maintenance preparation.

AI-generated editorial illustration; not a customer photograph or product screenshot.
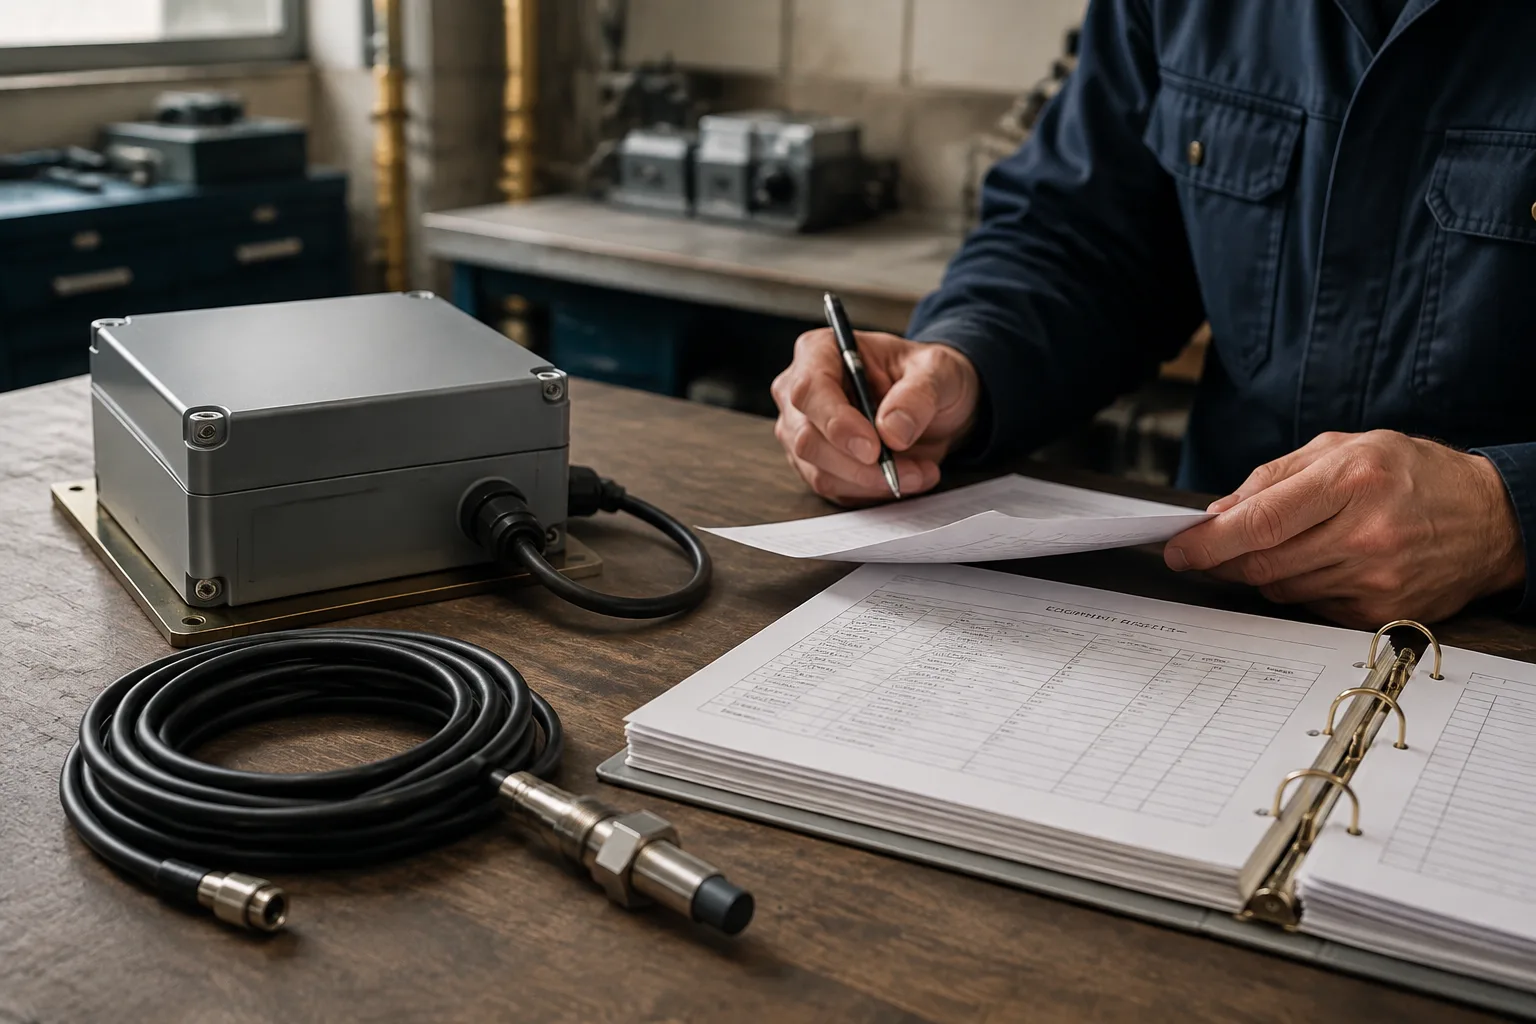
Use an event log to evaluate alert usefulness
Create one record for each reviewed concern. Include the asset, observation, operating context, review decision, resulting work and verification. Track data-quality incidents separately from suspected equipment conditions. A disconnected sensor and an abnormal physical measurement should not become the same failure category.
Review confirmed findings and unresolved concerns together. A count of successful interventions can hide excessive false alarms or a large unresolved queue. Equally, an inspection that finds no defect may have been a reasonable response to uncertain evidence. Evaluate whether the decision was appropriate given the information available at the time.
Avoid claiming that every completed repair prevented a breakdown. The counterfactual is usually uncertain. Report what was observed, what action changed and what cost was actually incurred. Keep estimated avoided losses in a separate scenario with its assumptions and responsible reviewer.

AI-generated editorial illustration; not a customer photograph or product screenshot.
Close the loop with comparable verification
After approved work, retain the verification required by the equipment procedure and the condition-monitoring plan. Where measurements are compared, record whether operating state and measurement configuration were comparable. A lower reading under a different load is not automatically evidence that the repair corrected the original concern.
Preserve changes to sensors, mounting, software rules and equipment configuration. These changes can affect a trend independently of asset health. Without that history, a future reviewer may draw an incorrect conclusion from a graph that appears continuous.
At the pilot review, decide whether to expand, revise or stop the application. Include ongoing analysis and support effort in that decision. Use the IoT sensor guide for measurement and integration questions, and the manufacturing maintenance guide for the wider maintenance programme. PreventiveHQ can organize the resulting work orders; specialist condition analytics remain a separate capability to evaluate.